Maybe you folk just need to my region of the world where the only four data sources available easily fits on the screen ![]()
1 Like
@duane well said. Really like your train of thought. also double tap single tap would be a good thing it’s Thunder Storm season here Tornado Season in the mid west and Hurricane Season in the South/Eastern areas. I also find myself using compare alot.
1 Like
I use them but not against change for over all good of the App.
1 Like
Yes, radar for sure!
3 Likes
This would be so awesome!
1 Like
Radar for Sure 
1 Like
I think icons are useful, so please keep them (somewhere).
I like your attitude of “not adding a feature” rather than adding and then removing.)
I agree that to eliminate the need for vertical zooming by means of simpler ways to work around the problem, seams a better way to spend time. Perhaps “reordering to raise prioritized data sources to the top” is all that is actually needed to accomplish this. (At lest until radar and whatever other higher prio feature is done.)
Not sure what you refer to with “card display”, but a suggestion is to have a portion of the screen (at the top or bottom) that is not moving while graphs are being scrolled up and down, and there display the days, and also the row with, in text, the time, temperature and so on.
Having only one row with the time, temperature and so on, means that one of the graphs need to be selected some how, for example by single tap, and should be marked / highlighted.
So as soon at thees are done,
I would directly ask for the the row with the time, temperature and so on.
If the “select and highlight one of the graphs” is not a quick fix with low risk for bugs, then, at least, I would prefer having the row with time, temperature and so on, to be under every graph in compare mode, (like weekdays are now).
This feature would be very much appreciated, at least by me, since the thing I want to use the compare mode for is to quickly be able to read (on graph and in text) the values for temperature, precipitation and wind speed for different times for the different sources.
I like that we can discuss the pros and cons of adding features, and i rely appreciate your transparency in your thinking and your workflow @duane, this is a big part of why I’m willing to engage in a forum like this and to be an owner of a gold subscription.
Keep up the awesome work!
1 Like
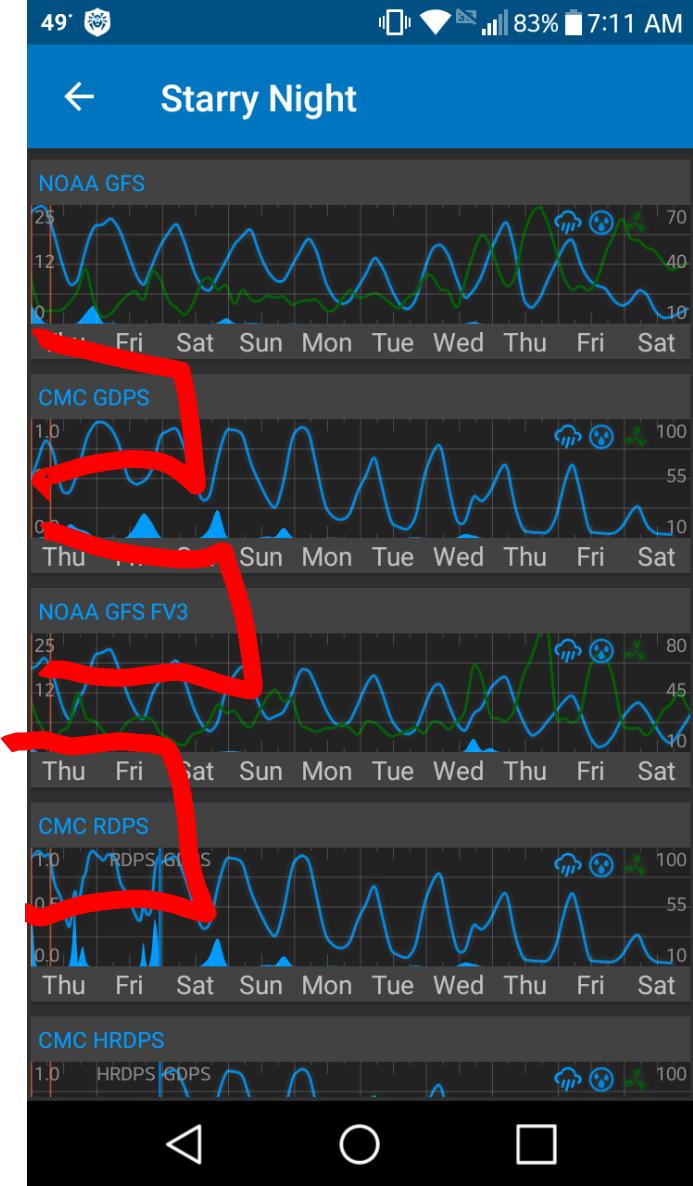
@BrianLY-38 I think that in your picture, the red markings are surrounding the
.
If the card display is the name of the particular graph being used (Starry Night, Sailors Delight etc), in the blue field at the top then I’m all for hiding it in compare mode.
I say let’s make the compare mode completely full screen! Or ad a separate option in settings under “Fullscreen mode” that would be “Compare graphs in fullscreen”.
While I’m in “Compare graphs mode” and am parsing multi variable data from from several parallel sources, I’m not necessarily interested in knowing my battery and Wi-Fi status, but when I’m checking the wether on the map I actually might be.
2 Likes
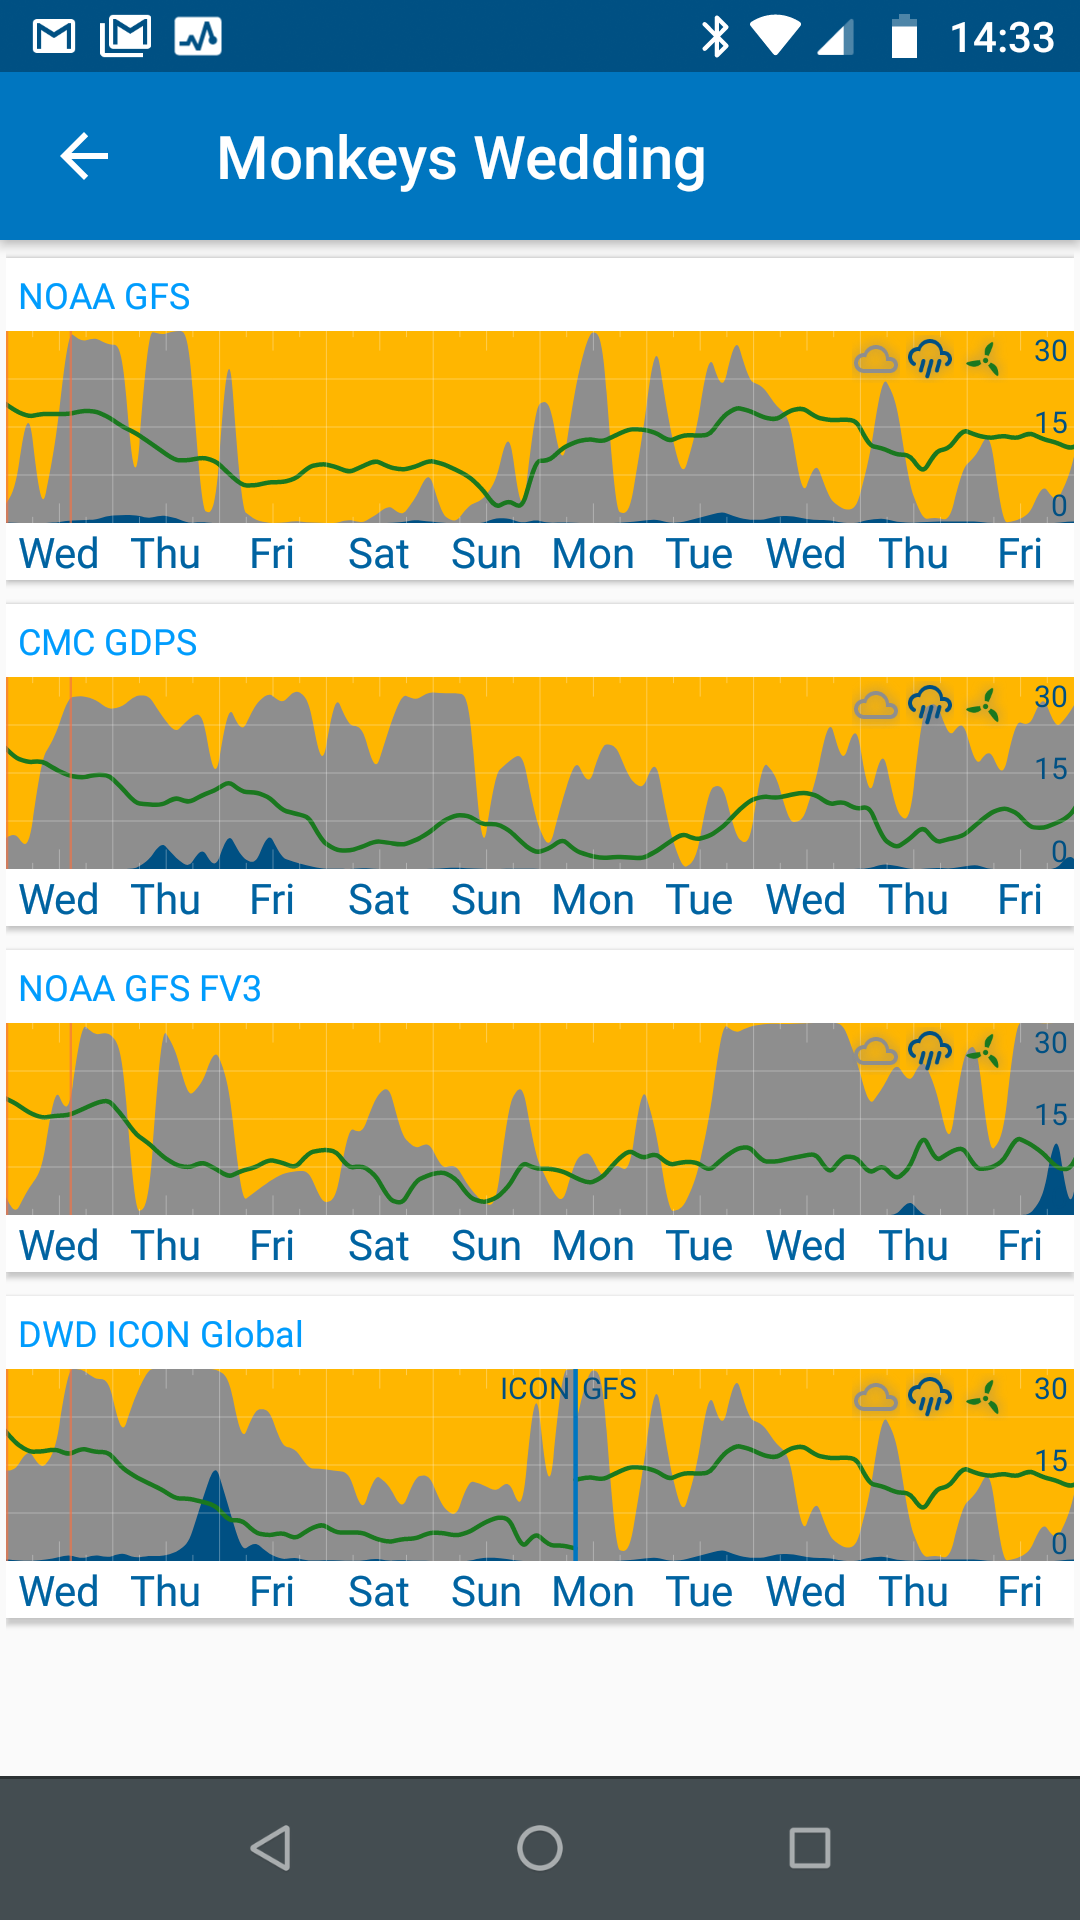
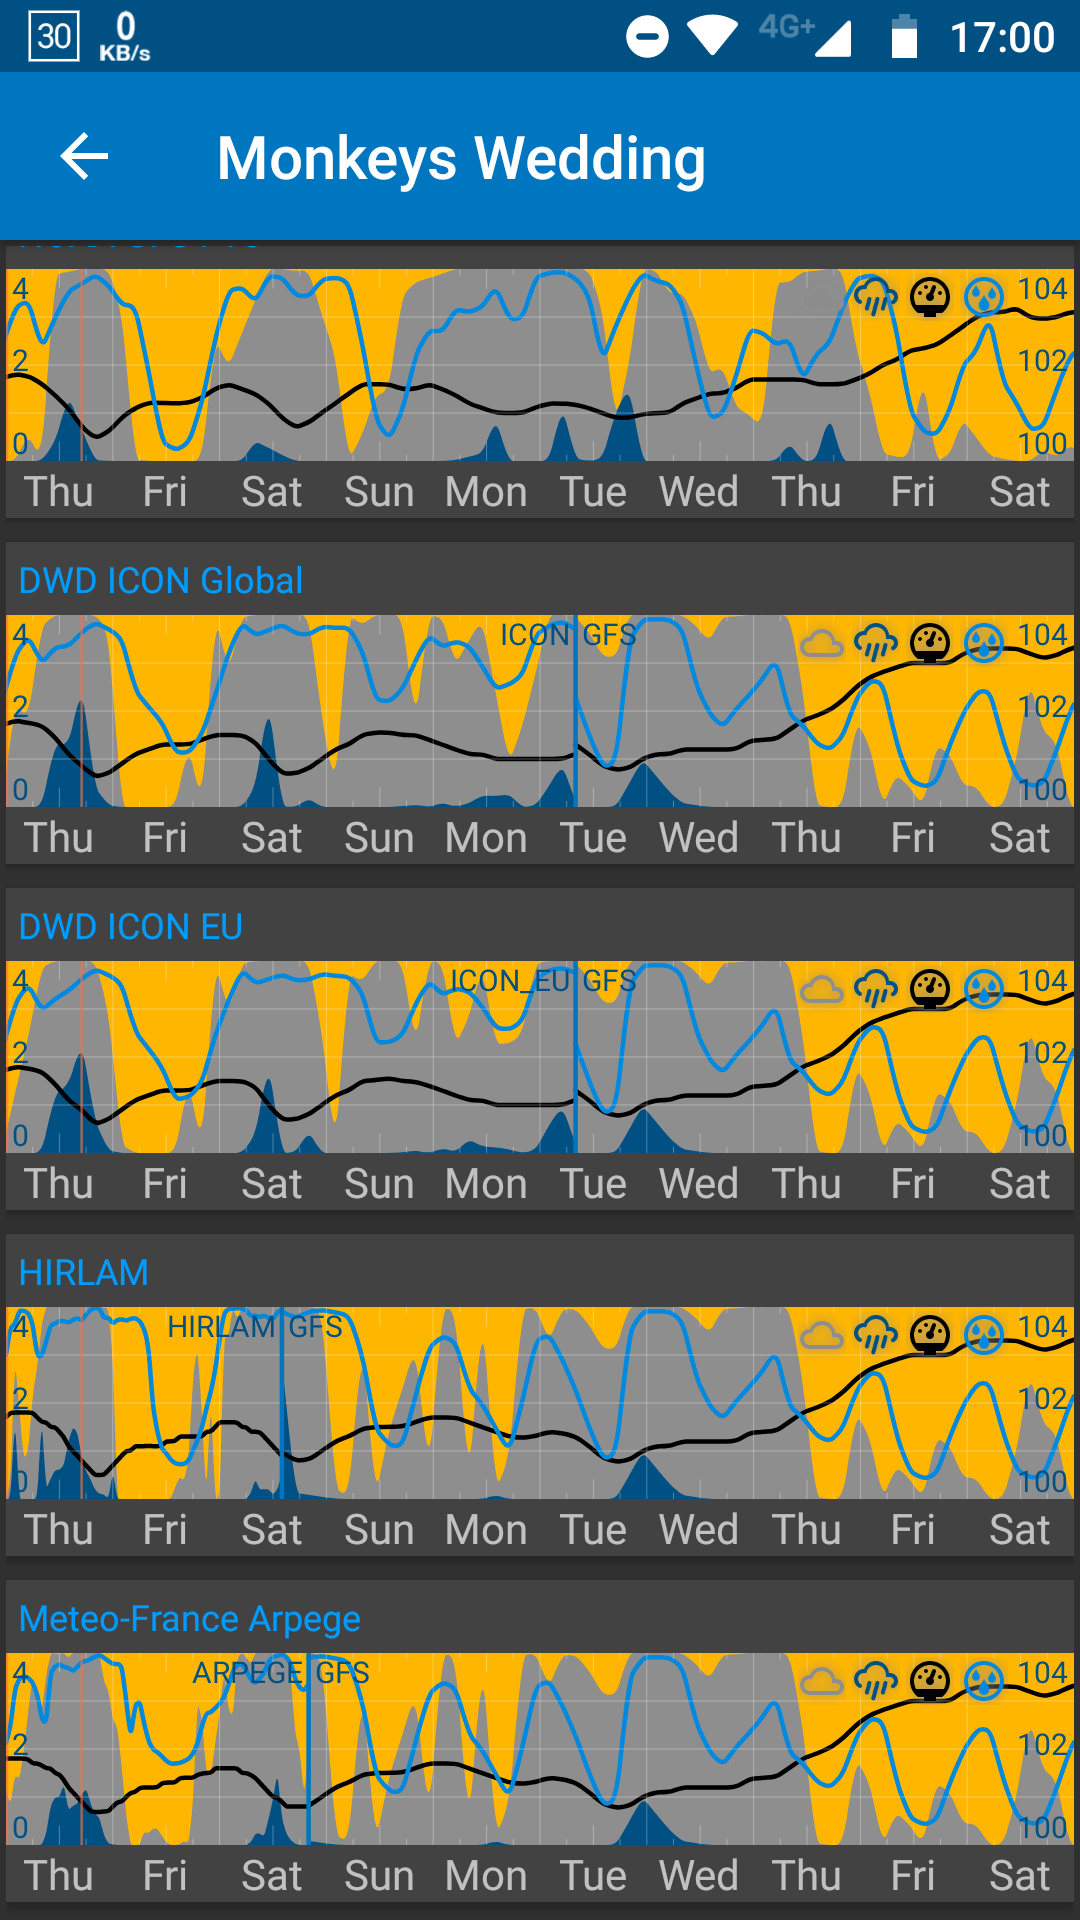
I just want to point out that when displaying more days than what is available in a data set, and when then another dataset is filling the rest of the graph, then both the names of the two data sets are displayed, together with the icons.
And I think this works fine, so there is no need to remove the icons in order to make space for the data set names. Wouldn’t you agree?
1 Like
@Ohan you’re right my apologies I uploaded wrong photo I was on here and messenger with a friend sent him the photo ment for here lol brain fart 

1 Like
That’s OK @BrianLY-38, I actually read the first version of your comment that had a seaingly more correct description.
It comes to me as email notifications. (You can also tap the orange pen top right of an edited post and read earlier versions of it.)
1 Like
yep when I edited it my thought train derailed 

2 Likes
I would find it really useful to be able to tap anywhere to have a vertical line appearing across all graphs and somewhere (at the top?) display the hour.
My use case is I’d like to be able to see the hour when most of the graphs agree that rain/snow is starting and stopping.
2 Likes
@ericm on the main page or on the compare Graph section? If on main page some are asking for single tap to open the compare graph section.
On the compare graph. It’s great seeing all the models stacked against each other. I’d like a way to be able to identify when something interesting is starting/ending. In my case, that’s predicted rain. 
2 Likes
@ericm if I remember reading another post correctly I believe a swiping action has been added to the todo list so you’ll be able to swipe in compare mode
1 Like
Long thread, so I’ll summarize my understanding: @Ohan is driving for what’s quoted above (in compare mode) to see text data (the time, precipitation, wind direction, etc…). I have a supportive alternative suggestion to follow; because this won’t work as requested. As text data would have be added under each “compare” graph. (Blegh)
@duane suggests to
(but I can’t figure out to what end - in compare mode that is; which has no text or map data)
I would suggest compare mode allow long press menu options on each graph, to (…wait for it…)
switch the data source on the main screen.
Thinking about this makes me think, a double-tap (vs long-press) on a “compare” graph, to load it’s data set on the main screen, is consistent with a “main screen” double-tap to load all the “compare” graphs.
Double-tap, review, double-tap, then interact with a new data set. Repeat.
This double-tapping seems like as KISS an extension of the current (awesome) gen 1 “compare graphs”.
Yes, this is just a linking of the current data set selection drop-down in the main view to “compare graphs”.
But, I’ll use it via double-taps.
I never use the drop-down.
1 Like