@Oak, are you talking about radar or rain data in other data sets.
One thing to be aware of is that as you zoom in, it’ll download higher resolution tiles and if you haven’t zoomed in previously, it’ll download the radar for the whole day, which can take a while.
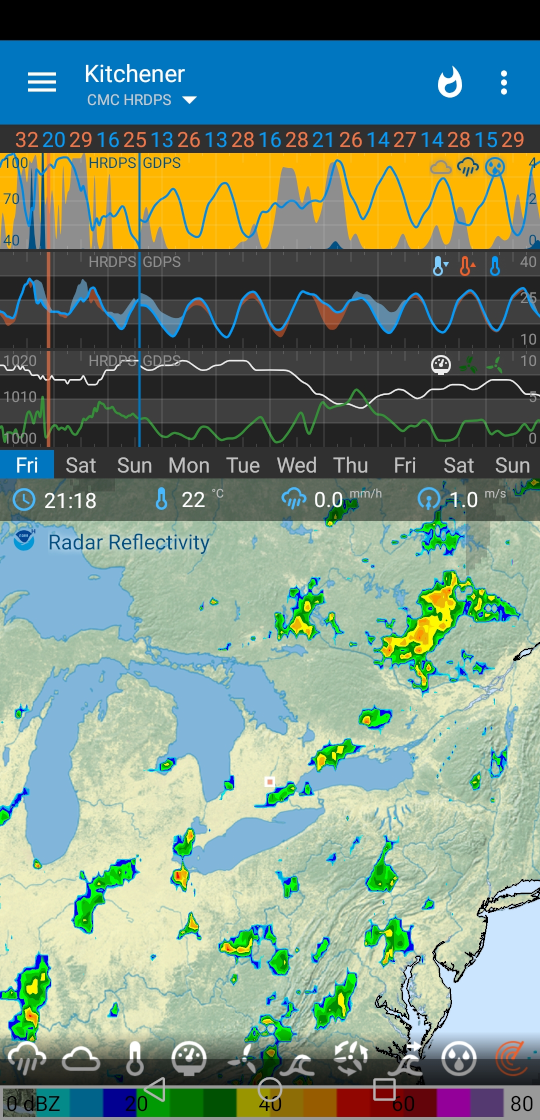
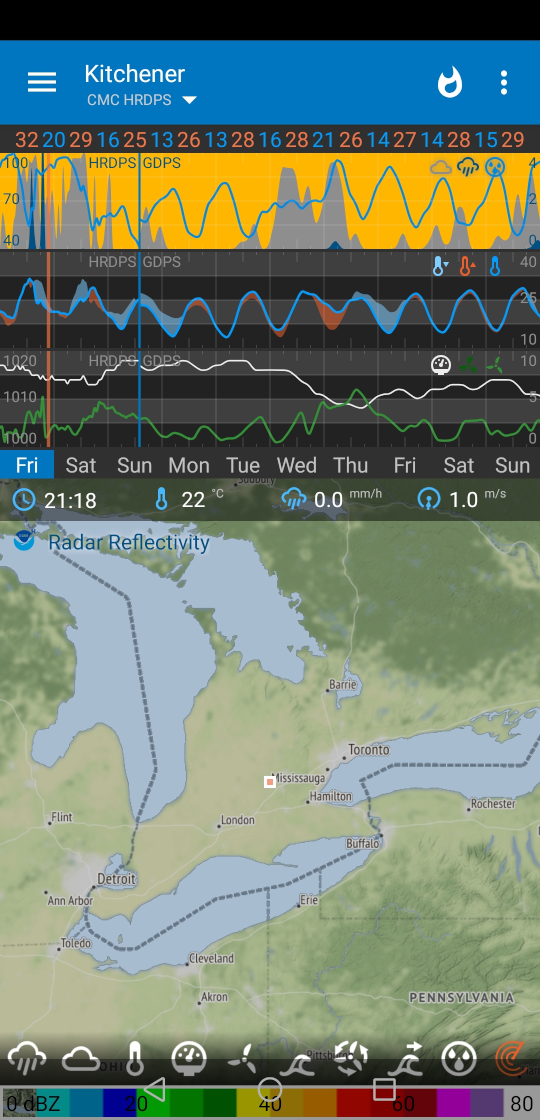
@duane I was also thinking that zoomed out will show rain however zoomed way in might not show cause there maybe no rain. and like it’s mentioned before Radar can show rain and it doesn’t make it to the ground
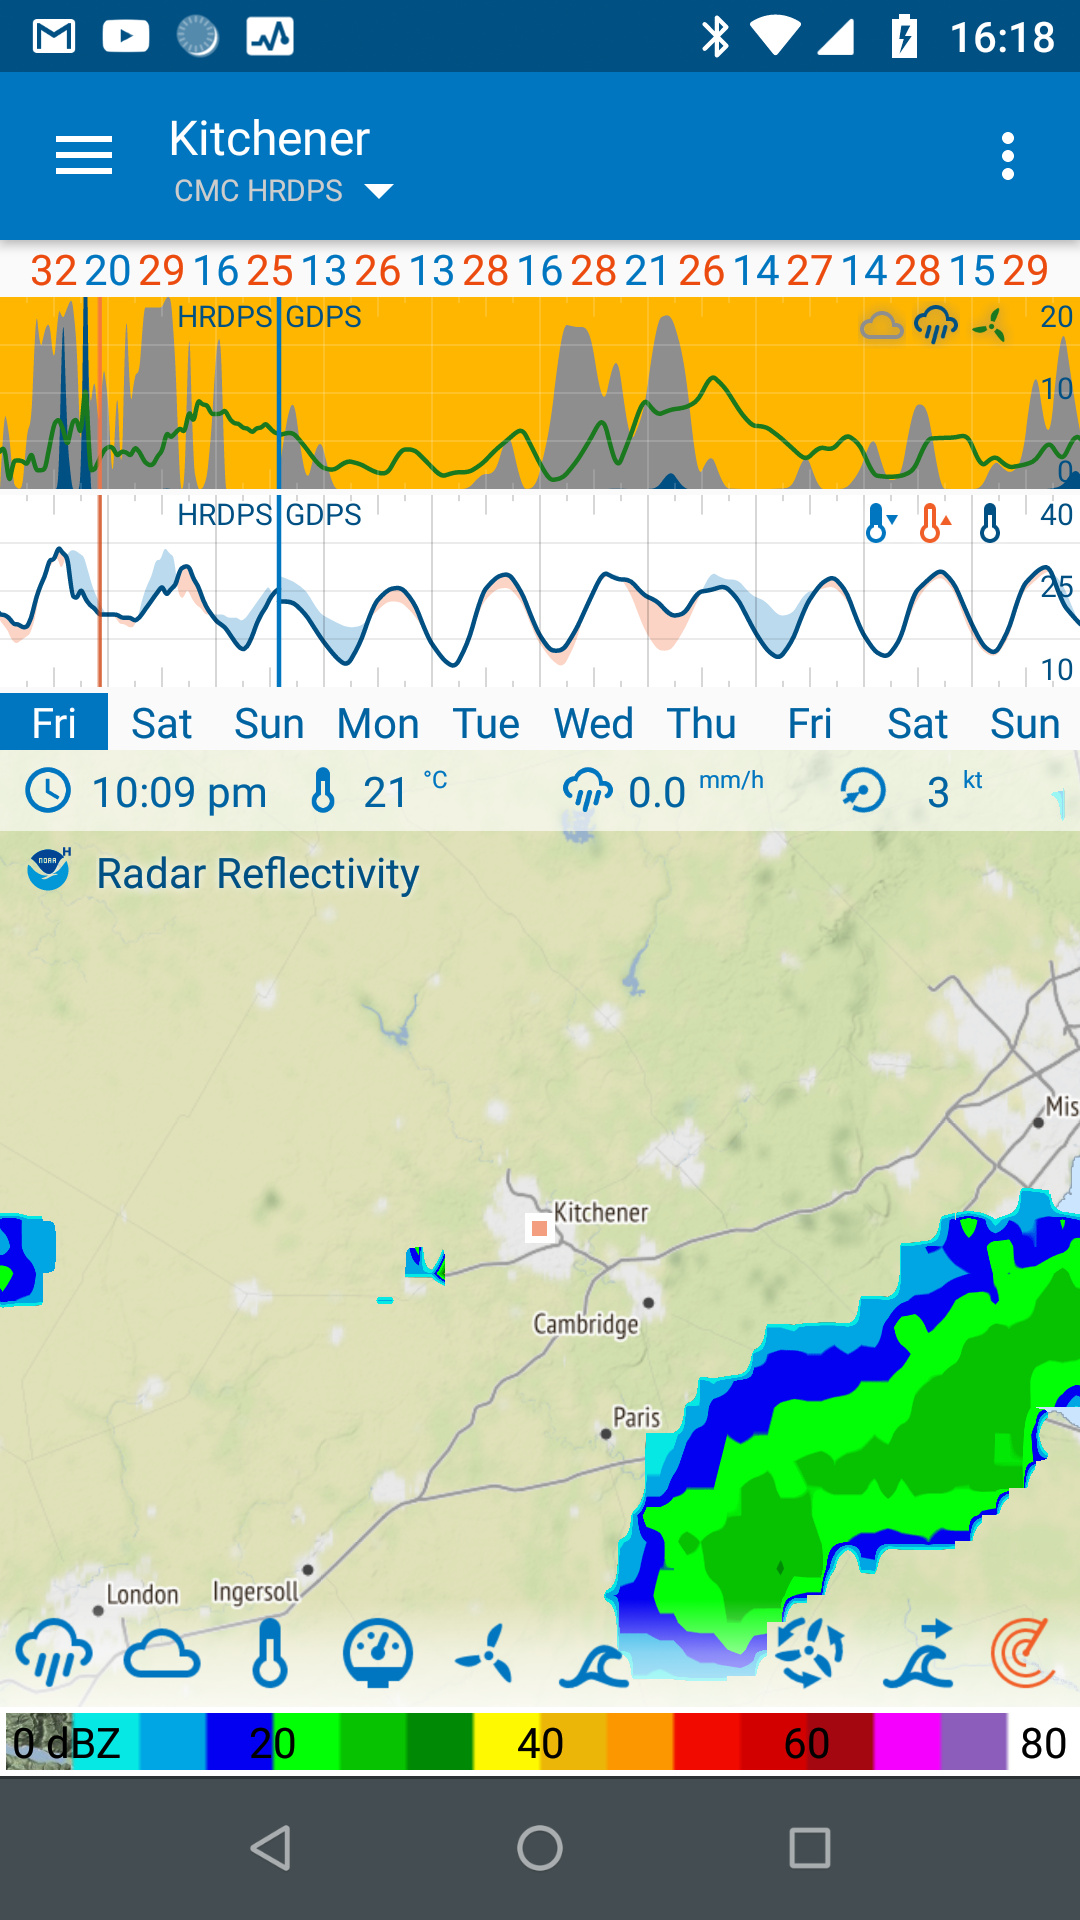
Looks to me like I should see something – there’s some kind of radar data – at the closer zoom. Don’t know how long it would take to get a new set of “close” tiles; I’m doing this at home with a reasonably fast wifi connection.
I would be surprised. The process to download, load and render radar is exactly the same at high or low zoom, the only difference is the url used to download data and the size of the tiles. It’s very unrelated to the Android OS version.
I’ve been getting the impression it’s pretty odd, yeah.
The map dims just an itz on zoom in when it switches from the shows the data scale to the doesn’t show the data scale. That might mean something. I’ve got three graphs running, where your working example shows two; I can’t imagine why that would matter but it is a difference. (Deleting graph three doesn’t help.)
There is currently no rain anywhere in Newfoundland (!!), but “Kootenay Boundary D” shows rain when zoomed all the way in.
When I used the place-selector to switch back to Kitchener from Kootenay, rain showed at a fairly close zoom; when I touched the zoom even slightly, the rain went away until I’d zoomed back out to the same zoom level that was showing it before on the other map. Same dimming effect with Mapbox Streets.