it would be a very good idea to include these parameters
@Josepalb Hello and Welcome to the Forum and Thank You for Using Flowx
@Josepalb as far as Rain Accumulation
All of those are on the todo list.
@Josepalb Welcome to the forum!
Hi @Josepalb,
I’ve had others ask for data at different levels. Can you give more details why this data is of interest?
I’m not a meteorologist and knowing why and how you use the data helps with design of the app.
Cheers, Duane.
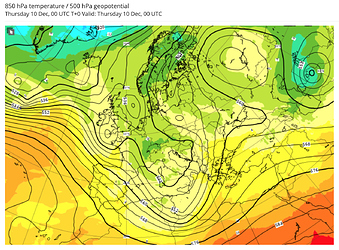
Of these, geopotential at 500 hPa is far and away the most useful. It’s useful because it’s basically the mid-level of the troposphere (the part of the atmosphere where the weather happens) and is the pressure level that most clearly shows high and low pressure systems (i.e., weather systems). See for example, this plot of ECMWF data which shows geopotential height values at 500 hPa with contours:
I don’t think pressure or temperature at 850 hPa is all that useful if you already have those values at the surface (which is already the case right now in Flowx).
Additionally, my 2 cents is that accumulated precipitation is not all that useful for showing in map form. Useful if you’re looking at a point forecast (a forecast for a specific location) and you want to know how much total rain is going to fall during a given time, but outside of that, accumulated precipitation tends to make maps less clear. I think how Flowx does precipitation now is great.
(I’m a professor of atmospheric science)
Sorry for answering so late.
The interest is because in the temperature at 850hpa we can know the arrival of cold and heat waves, and their impact.
in the 500hpa layer we can know the impact and severity of the storms.
