So on a graph, there’s a bump for any particular rainfall event, going from zero amount to some amount and back down to zero amount. (amounts variously in mm/hour, cm/hour, or inches/hour.)
The area under that bump on the graph is the forecast total rainfall accumulation; it’d be great if we could get that number (suitably rounded!) as a number on that portion of the graph in some suitably high-contrast colour.
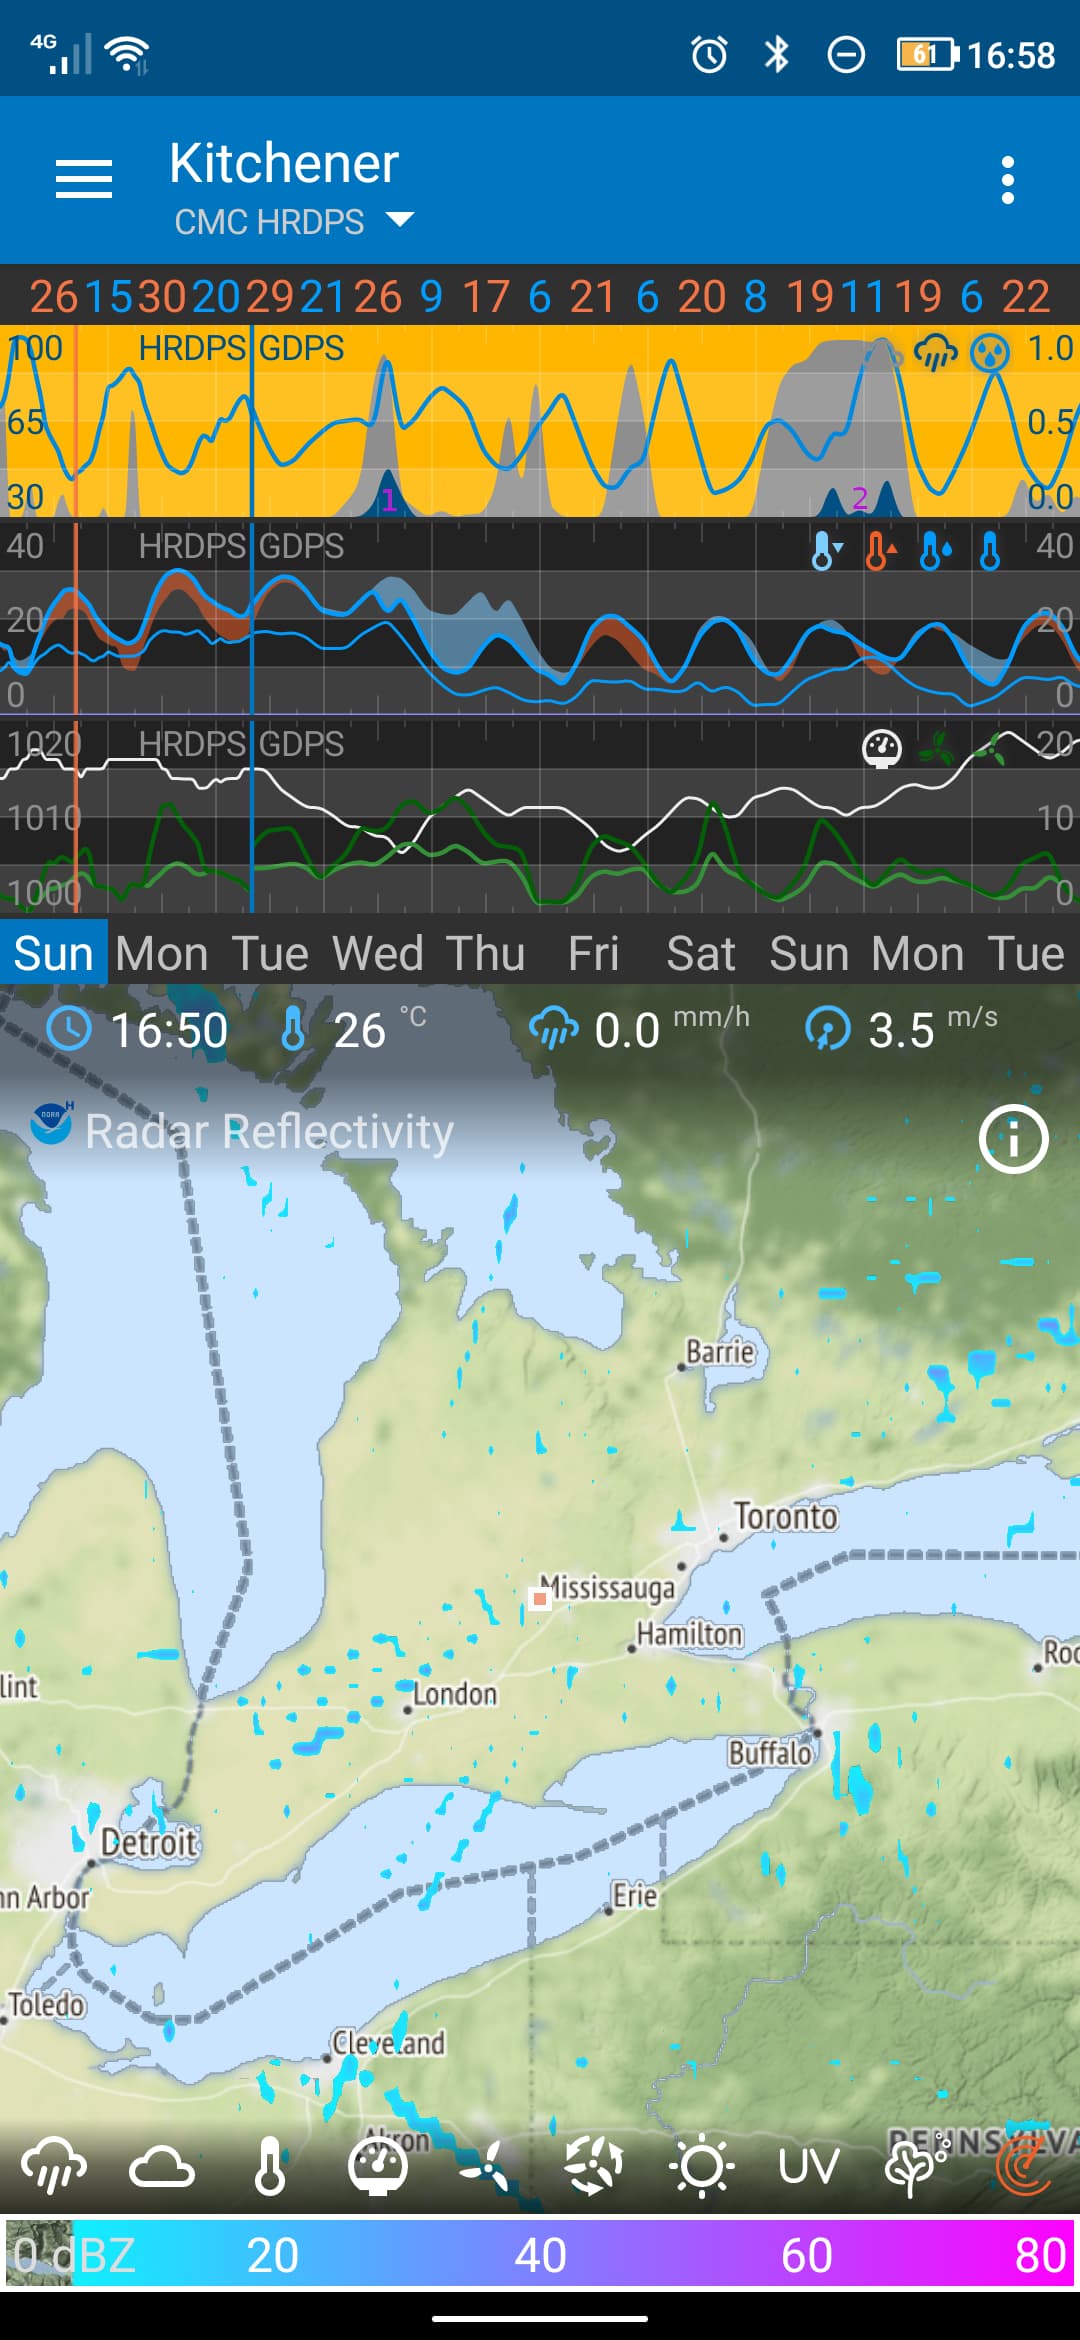
One edited screenshot, with the caveat that the numbers are not an attempt to produce a correct quantity, just an example of placement. (In the top graph, in the areas indicated forecasted rainfall.)
Better colour choices are likely to be available, too.
That’s quite a custom and complex request, especially defining one clump of rain vs another.
I do plan to add accumulated precipitation to the graph (without numbers) but you could add the accumulated number in the row of numbers below the week days instead.
I was assuming that if you can draw the graph, you can if all else fails count the pixels and relate that to an amount of rainfall, though I admit that’s possibly optimistic.
Accumulated precipitation is interesting but I’m mostly after a second indication for “how much is it going to rain?” The dynamic scale for rainfall in the graphs is great, but I live somewhere where the hi-res three day forecast switches rainfall scale amounts between 20mm and 1 fairly regularly. Having a label for “expected amount” would be great.
that would be difficult since even the radar can’t predict how much rain will fall in an area/location that’s why meteorologists say we can get X amount to X amount or we can possibly get up to X amount.
We don’t count pixel, rather we analyse the weather data. This is a custom analysis and we should get accumulated precipitation working first - it is one of the most requested features. I think you may get a similar result once we get accumulated precipitation working and show the accumulated precipitation in one of the gauges.
I am not saying the forecast is accurate or needs to be accurate, but that little blue volume on the graph is absolutely a rainfall forecast. Having a number associated with it would be handy.
I live somewhere the rate of rainfall swings between 0.25 mm/hr and 15 mm/hr. The dynamic scale is extremely helpful because it allows the 0.25 mm/hr to be visible as a time range in the high-precision forecast and the difference between 5 mm/hr and 15 mm/hr to show in the longer range forecast. I like the dynamic range quite a bit. I would just also like some numeric backup for clarity.
Accumulated precipitation is great for gardeners, etc.; for someone who is interested in “how damp is this specific rainfall event over its 3 hour duration?”, I expect it to be less useful. (still interesting! but less useful.)