I’m enjoying the app and the forum. Can’t remember the last time an app had so much engagement.
I live in London and wanted to ask others what they felt was the most accurate predictive map for rainfall. I cycle every day so knowing the likelyhood of rain is a great feature.
Usually I open the app in the morning and scrub through the day and watch for rain on the map. I’ve been swapping through a few sources and none of them yet feel “just right”.
Based on people’s gut feel experience, what is most accurate day->next day source of data for London?
My experience in Auckland is that one or two sources is better than others most of the time but not by much. Generally, no one data source is accurate 100% of the time and it’s better to look at all of them and average them in your head.
@duane I agree 100% I load each one slide back and forth for the week to see what each model shows on the map then pick somewhere in the middle. That’s exactly what meteorologist"s do is look at multiple models
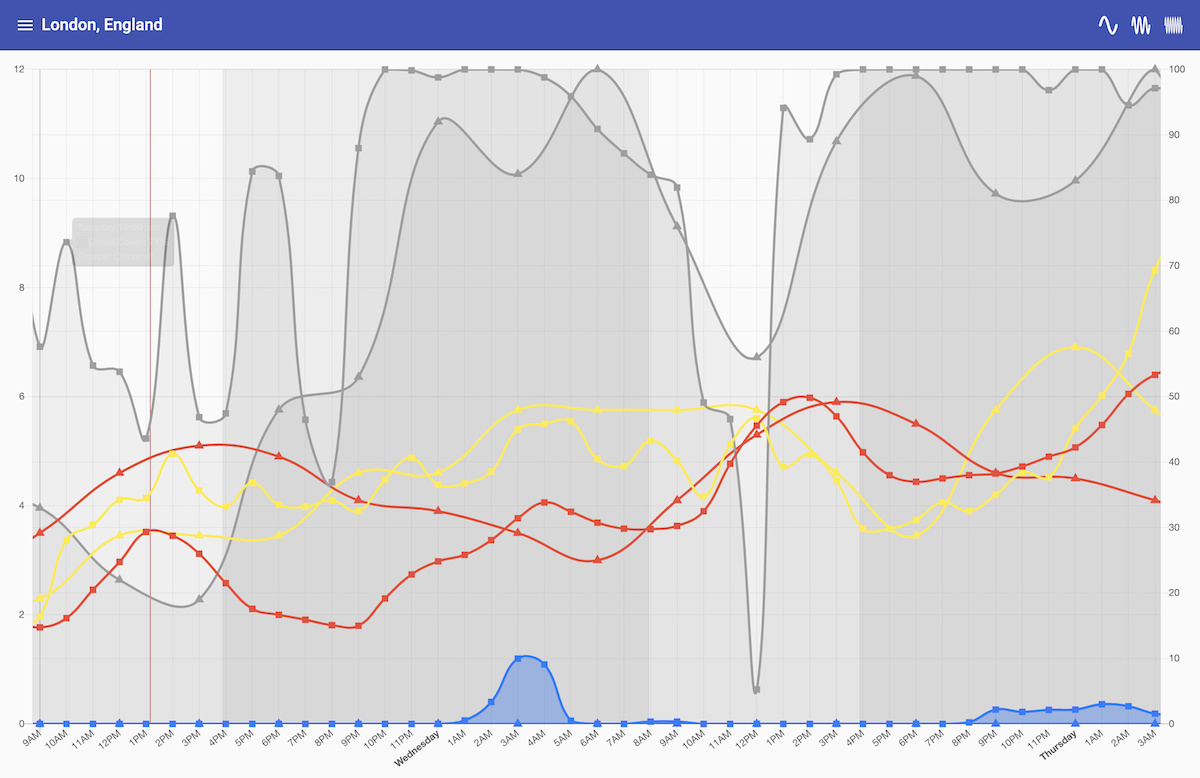
Which is useful as it shows multiple sources on the same graph, so one can mentally average the forecasts.
I’d rather a pessimistic average (additive of combined sources) for a rain forecast, but that’s just me as the “cost” of getting wet and not being prepared is higher than the cost of being prepared and not getting wet.
Thanks @BrianLY-38 I’d spotted that feature and it’s very useful, but for me part of the “synthesis” is the overlay of one on top of the other in one graph, rather than stacked serially.
I find that different models are accurate at different times. Perhaps depending on the type of weather systems and/or directions of the wind.
The brilliance with flowx is that you can compare the last day/hours of a model to the radar in the map, and then see which one has the best fit at the moment.
In general the models that had the most recent update has an edge, and they are not all updating at the same time, so that is also a thing to consider.
(In the 3-dot menue >“info”, you can see model time, and next update.)
@mick, regarding the sources used in “erismont”, I think these are MOS predictions. In other words, they have already merged and corrected biases of the weather model results using their secret sauce. So you are averaging the averaging and comparing secret sauces
I’m not saying this data is not useful, it is still useful.
When I redo the graph editor I will keep in mind the ability to plot multiple data sources but this will be advanced since it’ll just confuse new users and I’ll get heaps of emails.
Also I plan to introduce ensemble models to Flowx one day. This has 20 versions of the GFS and 20 versions of the GDPS models, you can look at. This is where the real power lies.