I have just reset my Android phone (Galaxy S23) to clear out a bit of junk and part of the process is installing all my main apps again. I quickly noticed that Flowx appears to be working differently after the reset, even though I presume it is on the same version as before.
Previously, I had set up one graph to show all the elements I was interested in. I also used this graph as a widget. I was able to show Total Cloud Fill, Precipitation, Temperature Line and Temperature Delta.
Now I have reset my phone and performed a clean install of Flowx, it looks like I can’t show this on one graph. The Everyday graph shows the clouds and rain, whilst the Temperature graph shows… the temperature.
Is this a deliberate change in functionality or am I just not setting it up right? I can’t believe this functionality was changed at the exact time I reset my phone, so I’m guessing the old functionality kept working if it had been configured that way.
I’m really hoping that I’m just doing something wrong as I would really miss not having one graph to look at.
I’m on Silver if that makes a difference.
Sounds like you cleared the Flowx data when clearing out a bit of junk on your phone. This will reset Flowx to a fresh state - like you just installed it.
You can edit graphs to create the design you want. See:
Thanks for your quick reply, Duane. When putting together my reply, I might have found the issue. I bought a Silver subscription in October and I had the ability to fully edit the graphs at that time. Looking at your website, you don’t appear to offer Silver now. Does that mean I have lost the ability to fully edit my graphs?
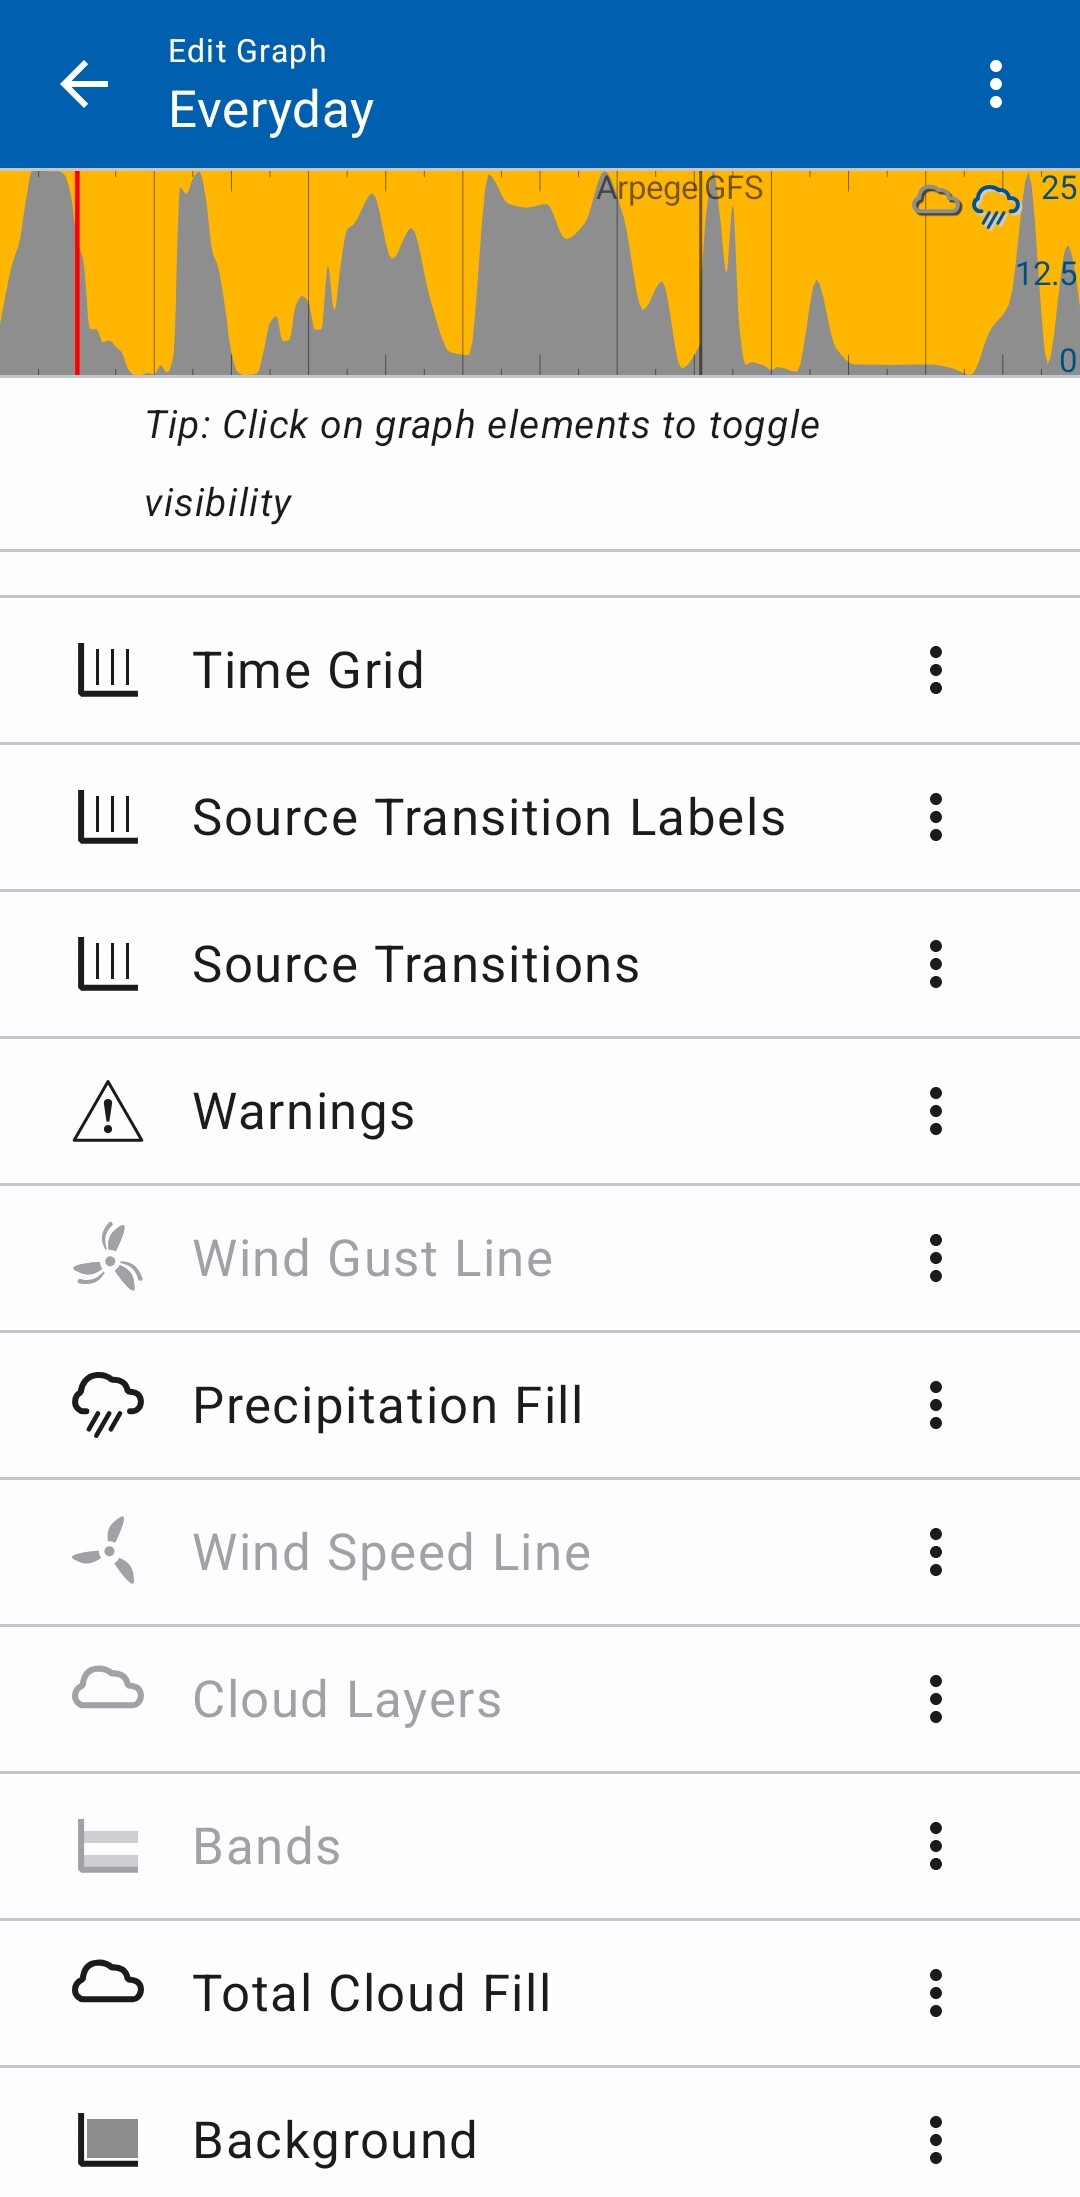
I have attached a screenshot that shows the bottom of the Everyday elements. I don’t get offered any temperature elements here, for instance. Is this what is likely happening? If so, is it possible to get back this functionality?
@pickle73 Hello and Welcome to the Forum and Thank you for Using Flowx
I’m pretty sure you can add other data, like temperature to the graph. Please check out the “Graph Editor” section at the bottom of:
Not on my version ![]() The screenshot above is the only elements available for Everyman. (Above Time Grid there is Time Marks, Legend, Y Scales and Y Grid). It looks like I have something between the free version and the Gold version. I can toggle each element on and off, but I have a different set of elements available for each graph type.
The screenshot above is the only elements available for Everyman. (Above Time Grid there is Time Marks, Legend, Y Scales and Y Grid). It looks like I have something between the free version and the Gold version. I can toggle each element on and off, but I have a different set of elements available for each graph type.
I tried deleting the data for the app and starting again, but it didn’t help.
I would like to get this fixed as it makes a great widget with all the information I need
Click on the menu to the right of an option, e.g., “Precipitation Fill” and select “+ Add”.
Ah! Great, thank you. I missed that.
I can add the cloud etc to the Temperature graph, but I can’t add the temperature deltas to the Everyday graph. But I now have the graph (and widget) that I want.
Thanks for all your help.
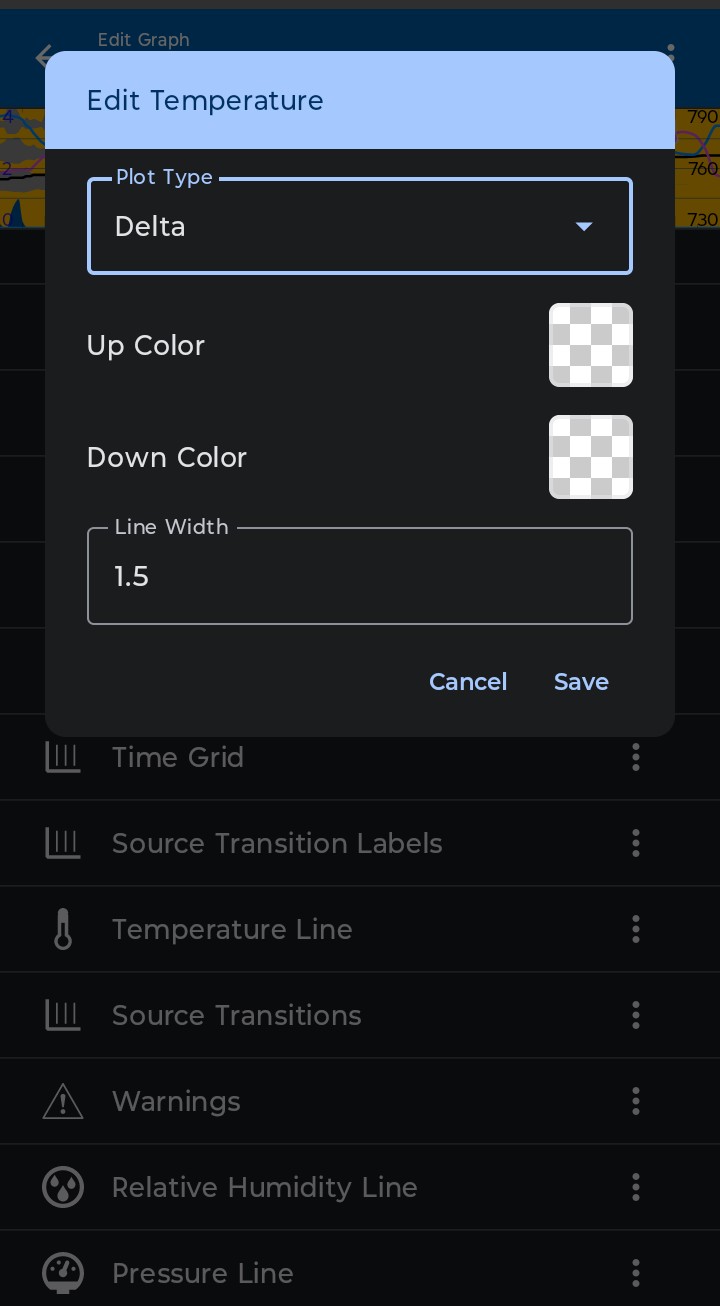
You can add the “temperature deltas” - it’s mentioned in the “Graph Editor” section.
Temperature Deltas is actually missing from Add Element. I tried on the Everyday, Wind, Pressure and even Temperature graphs. There is definitely a bug there but I don’t know how widespread it is. I’m running Android 16, Samsung One UI 8,5.
As I’ve said, I’ve managed to get around this by using the Temperature graph, which already has Deltas turned on.
A Similar thing is “Temerature levels” that seams to be missing from the add-menue.
But it is called “Fixed data levels” until you edit it and choose range to be temperature, then it changes name to Temerature levels.
@duane are there more items than these two that you add using one name and that changes name when you choose what it should display?
Since clearly I’m not the only one who got confused by the way items have one name in the add-menue, and it then changes name once you use it, maybe they all should be listed in the add-as the name that they will have when in use.
Sure the list will be longer, but it would make more intuitive sencere. If I remove “Temperature Deltas” and want to add it back, for sure I’ll be looking for something called “Temperature Deltas”.
The best user manual is the one that is not needed.
Thank you @Ohan! I’m finally there! I’ve now passed my Flow competency level. Still a way off from master ![]()