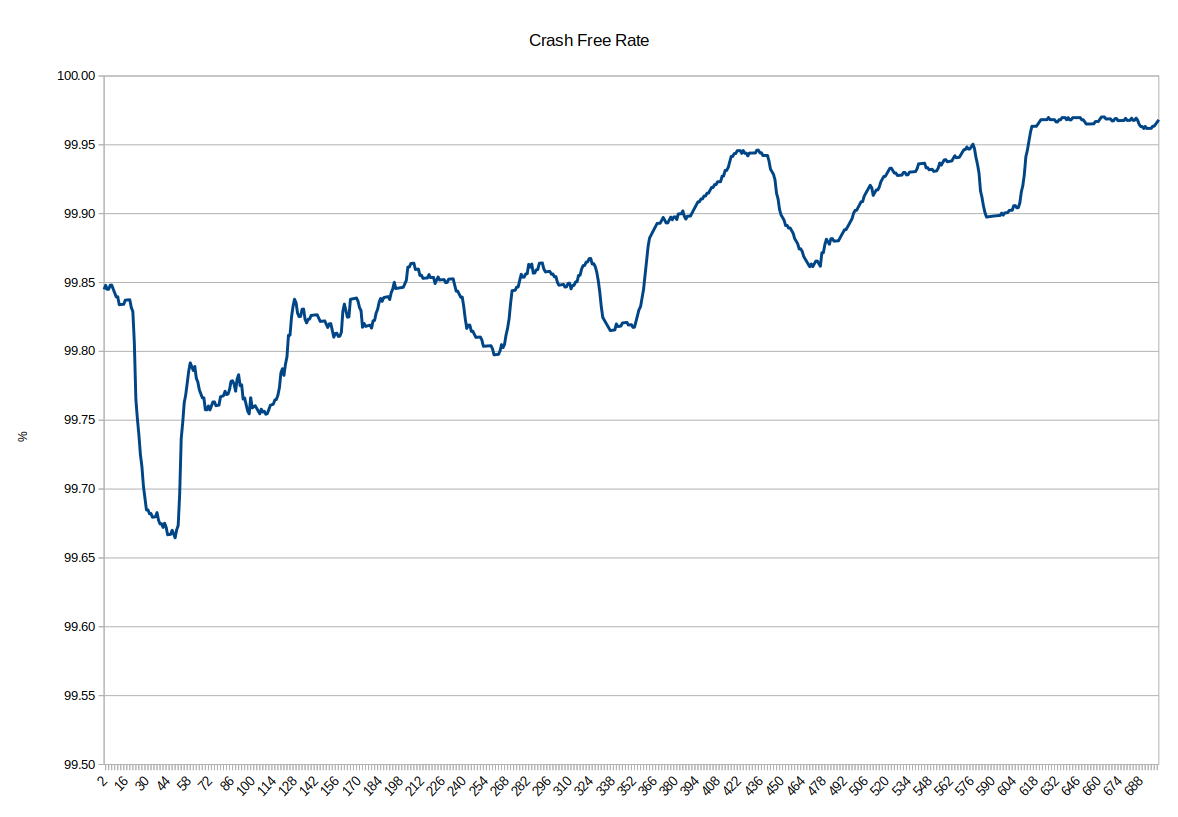
I thought you might be interested in these graphs. It show the 30-day rolling average of crashes and active devices.
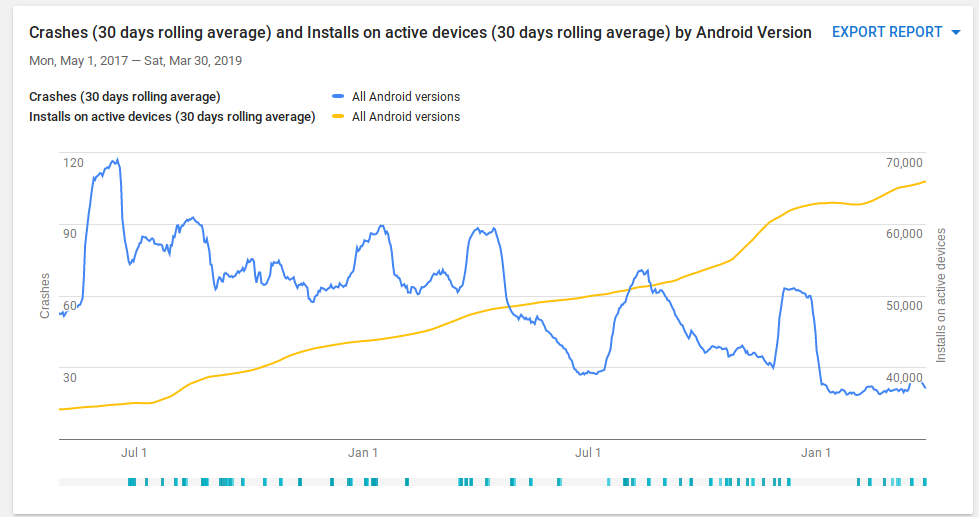
It shows I’m doing my job of reducing crashes  and you’re doing you’re job of telling friends about the app
I would like to divide crashes by active devices so we can see crashes per device. This would show a more dramatic reduction.
Cheers, Duane.