Please tell me, how are these three different radars all so different for the same location, time, and place while and all displaying the same data type?
What did I pay for? This isn’t a forecast. This isn’t the speculative data. This is the current, live precipitation radar, so the wild variation shouldn’t be, and yours is the one that is the farthest off compared to all the local and regional sources.
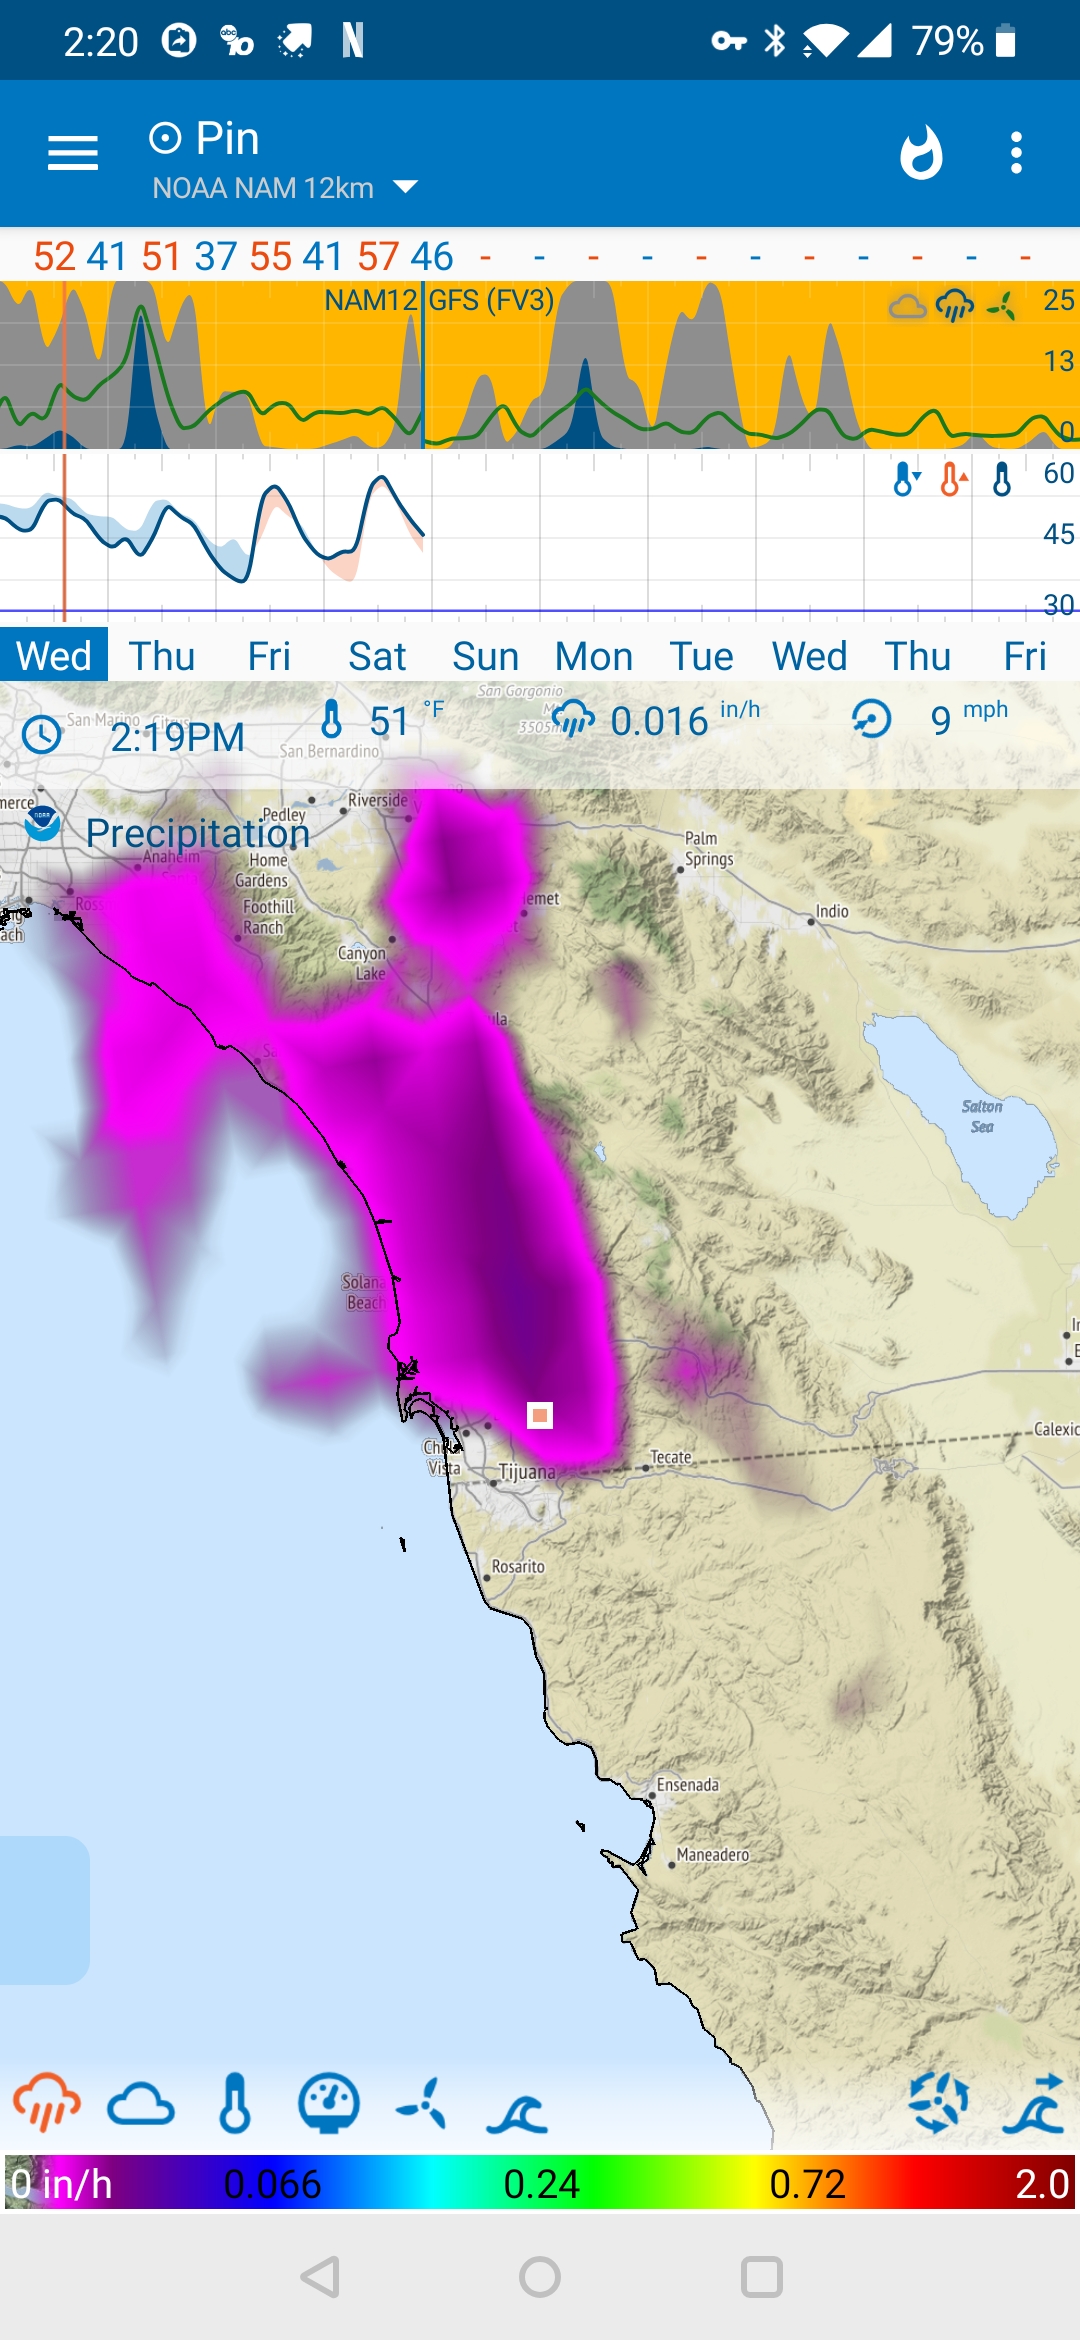
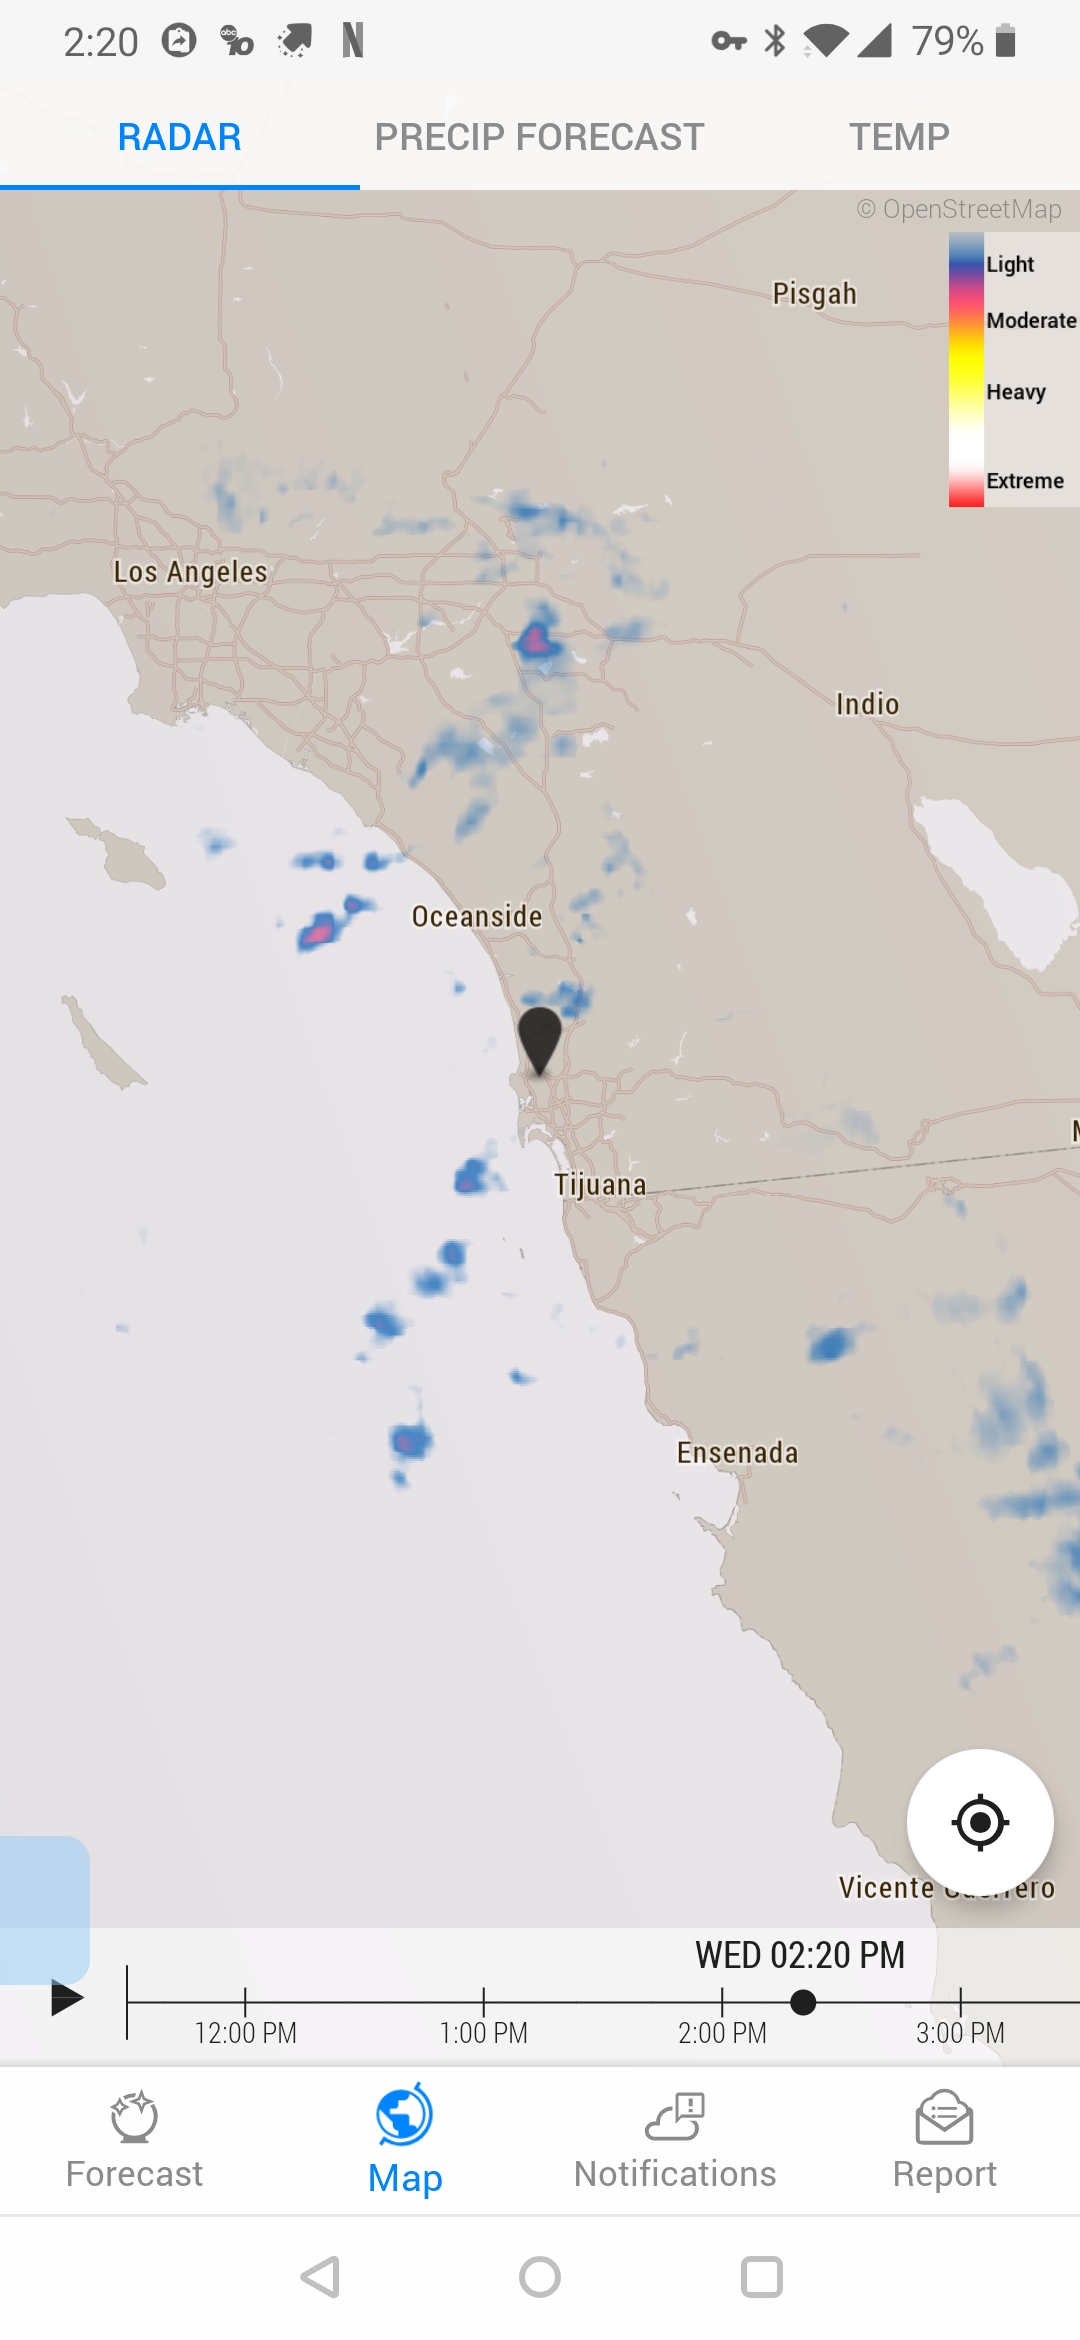
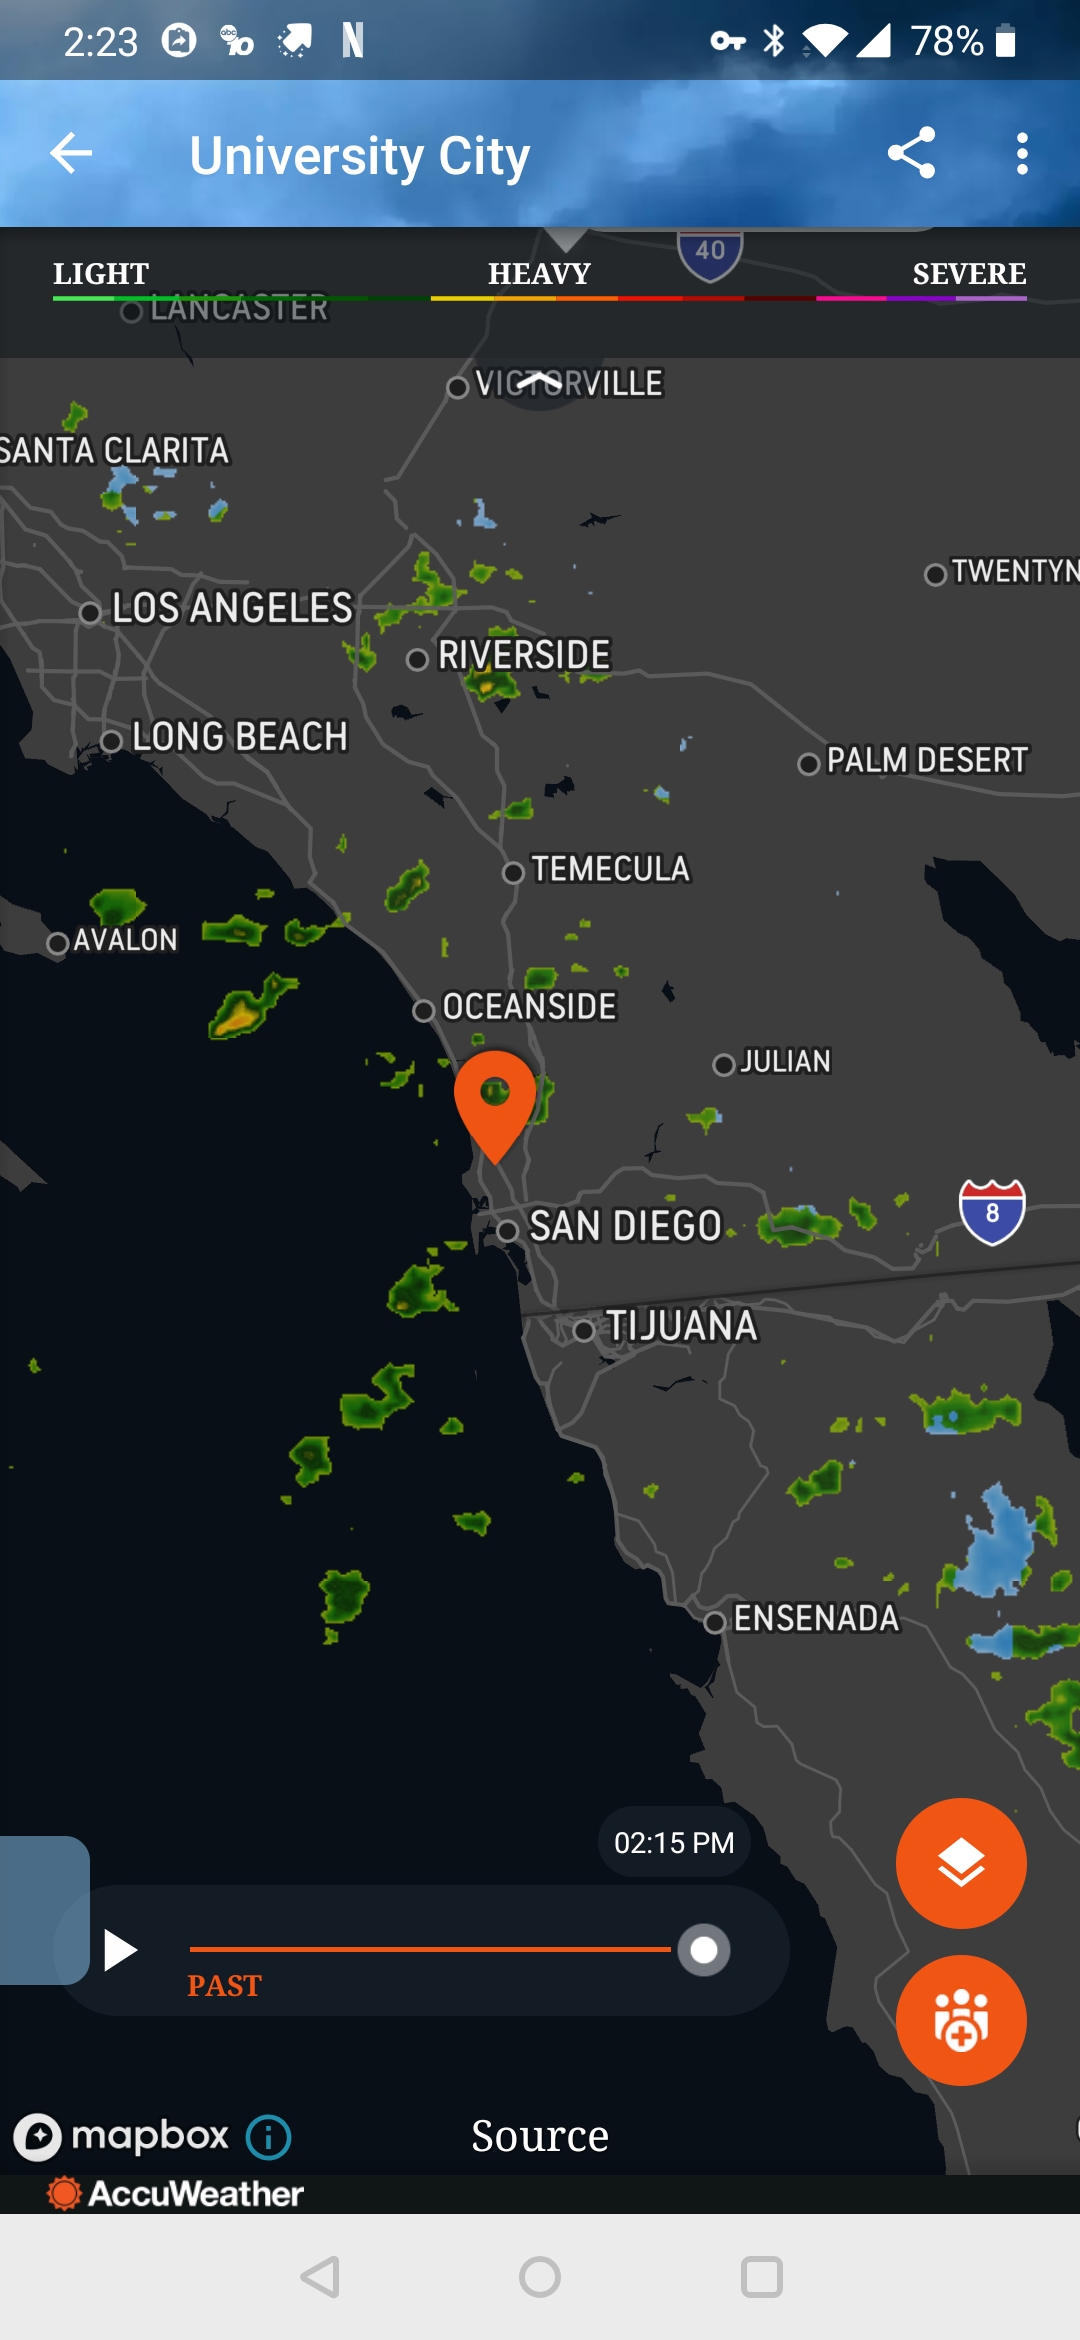
Hi, The precipitation data in the Flowx screenshot is the predicted precipitation forecast. This is the result of weather simulation solved by computers. The second and third screenshots are showing radar reflectivity. This is measured in real life using a radar system. Essentially, you’re comparing apples and oranges.
Please read What is Flowx and browse through the Help for more info - there is quite a bit of information here.
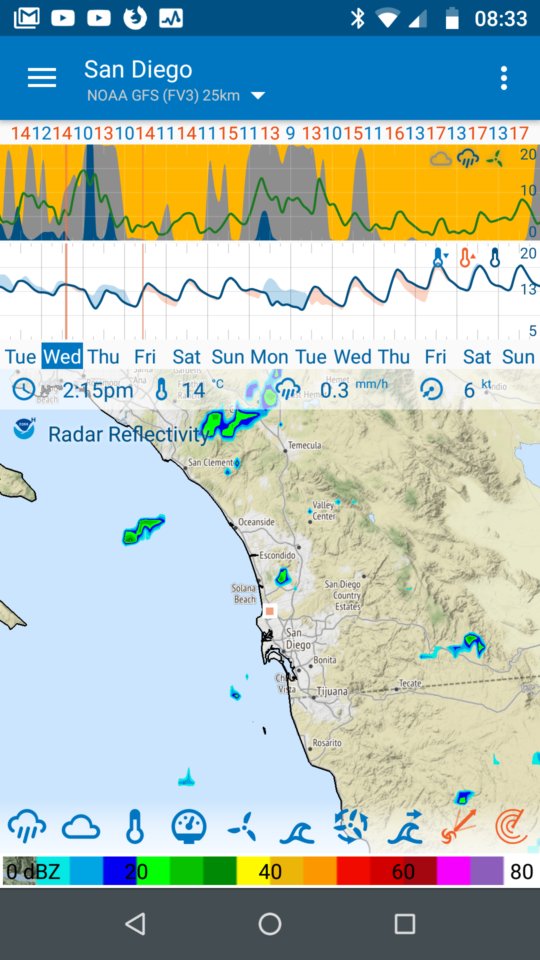
I’ve attached the equivalent radar reflectivity data in Flow.
 . Got it. Thanks.