I just installed FlowX and immediately got the top pro version – it’s exactly what I’ve been looking for. Thanks! On my desktop, I live by the Wunderground 10-day forecast graph. Everything in one place, no confusion about whether the daily low temp is that day’s morning or the next overnight. Graphs are the best!
The one thing I’m struggling with is that with the pro version and US HRRR selected, the graphs have two large bold vertical bars where each data source ends, a thin red line for “now”, and almost invisible vertical lines for the day boundaries. To me, it would be much better if the day boundaries were more visible and the data-source boundaries were thin and light.
(I’d also like to be able to edit the background color of the graphs rather than just dark/light. I know that would allow people to create unreadable graphs… but I’d like it. Especially for Cricket Chirps; the white is too white, and the dark is super dark. Or just allow picking an opacity for the widget – that’d do for me too.)
Regarding the bars. The bars demarcate the separation between data sources. I agree they can dominate the graph when you have 10-16 days. The days lines are thin but for some reason I’m used to them. And it seems others are too.
Unfortunately, I can’t change the theme since I’ll get 10-fold in revenge. User hate change - it’s one of the clear messages I’ve got from 8 years of Flowx dev.
That said, in the future I plan to add a theme editor that will allow you to change all these things.
The day/night background is also on my super-long-to-do list.
My current short term plans are to:
add spectrums to the scale editor
add sub-hourly time steps, currently we’re limited to 1 hour steps, but HRRR has 15m and 30m time steps.
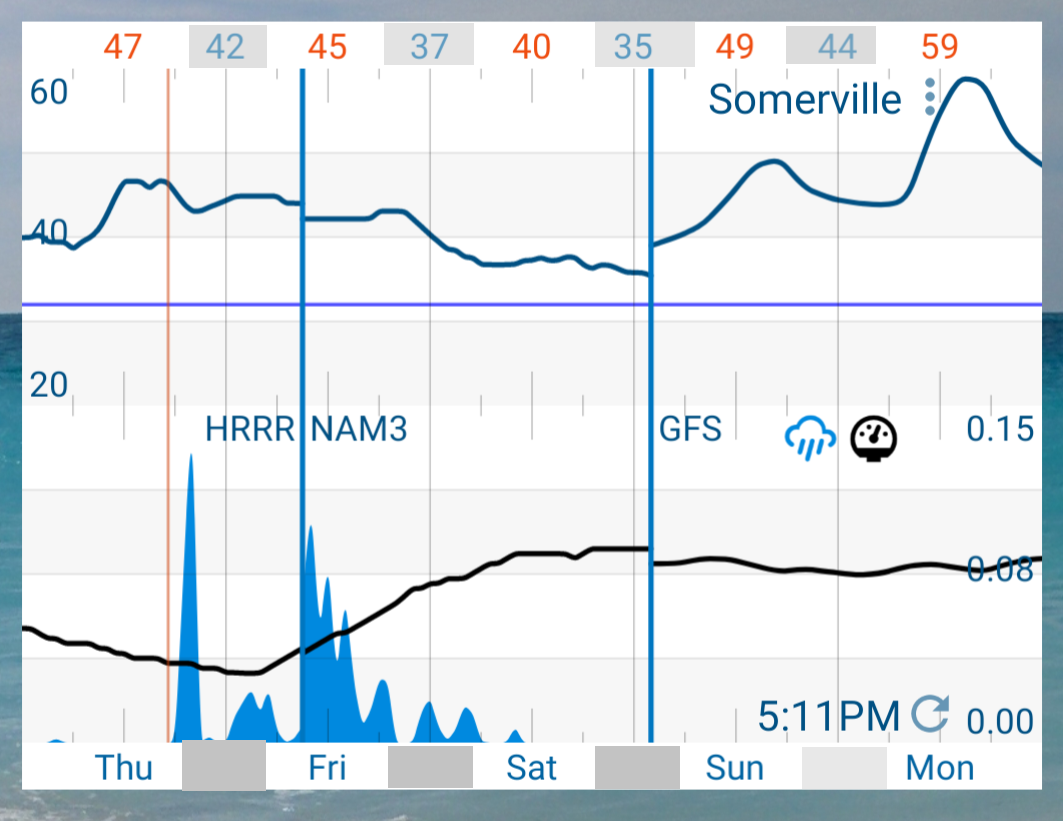
Fair enough regarding the theme (I presume you’re talking about adding day/night shading – or maybe just editing the bg color). Perhaps for the day/night shading something more subtle, like shading just on the top and bottom bars (day names and hi/low temps)? Here’s a screenshot from my widget so you can see how much the thick blue data-source bars dominate the visual look.
I took the liberty of adding gray “night” bars to top & bottom – I imagine them going from sunset to sunrise.
For the day/night, I need to implement code to calculate sun rotation. Code exists in Javascript but has to be ported to Java. I should check again, maybe someone has done this.
As a general rule, I don’t change themes, even if subtle. Once I change the shade of yellow to a slightly darker yellow and got emails complaining about it. Once I change the app name from WeatherBomb to Flowx, which didn’t change the function of the app - man, did I get some hate mail! The best was “WTF, thanks for ruining the best weather app I’ve ever had”. It wasn’t even his weather app
I’ve learnt two things:
People hate change.
I can’t satisfy all the people all the time.
Another common issue is that new users find Flowx overwhelming on first open. There are too many new things to those who are unfamiliar. Currently, the app is in a nice balance between uncluttered and complete. So I don’t want to add more noise. Instead, we keep the current initial layout and you can add/remove what you need - just like adding the number of days and data. But this means I have to implement editors to do these things.
Yes, I found this library too. I woke up at midnight last night thinking about it. I’m quite excited to add it. Not sure when I have to do some other contract work first.
I’m a new user (refugee from Dark Sky, also use Windy). I’d like to second this proposal. It would be great to have vertical day/night shading on the graphs, ideally based on duration of the day (sunrise / sunset). A bit like the horizontal scale shading bars.
Any chance a full sunrise to sunset ‘night’ feature can be added? For stargazing I’d love to see cloud cover over the night time. (I run a Planetarium).
P.S. I’m loving the FlowX app’s radar swipe feature! I use it in conjunction with the super highly customizable Meteogram widgets app.
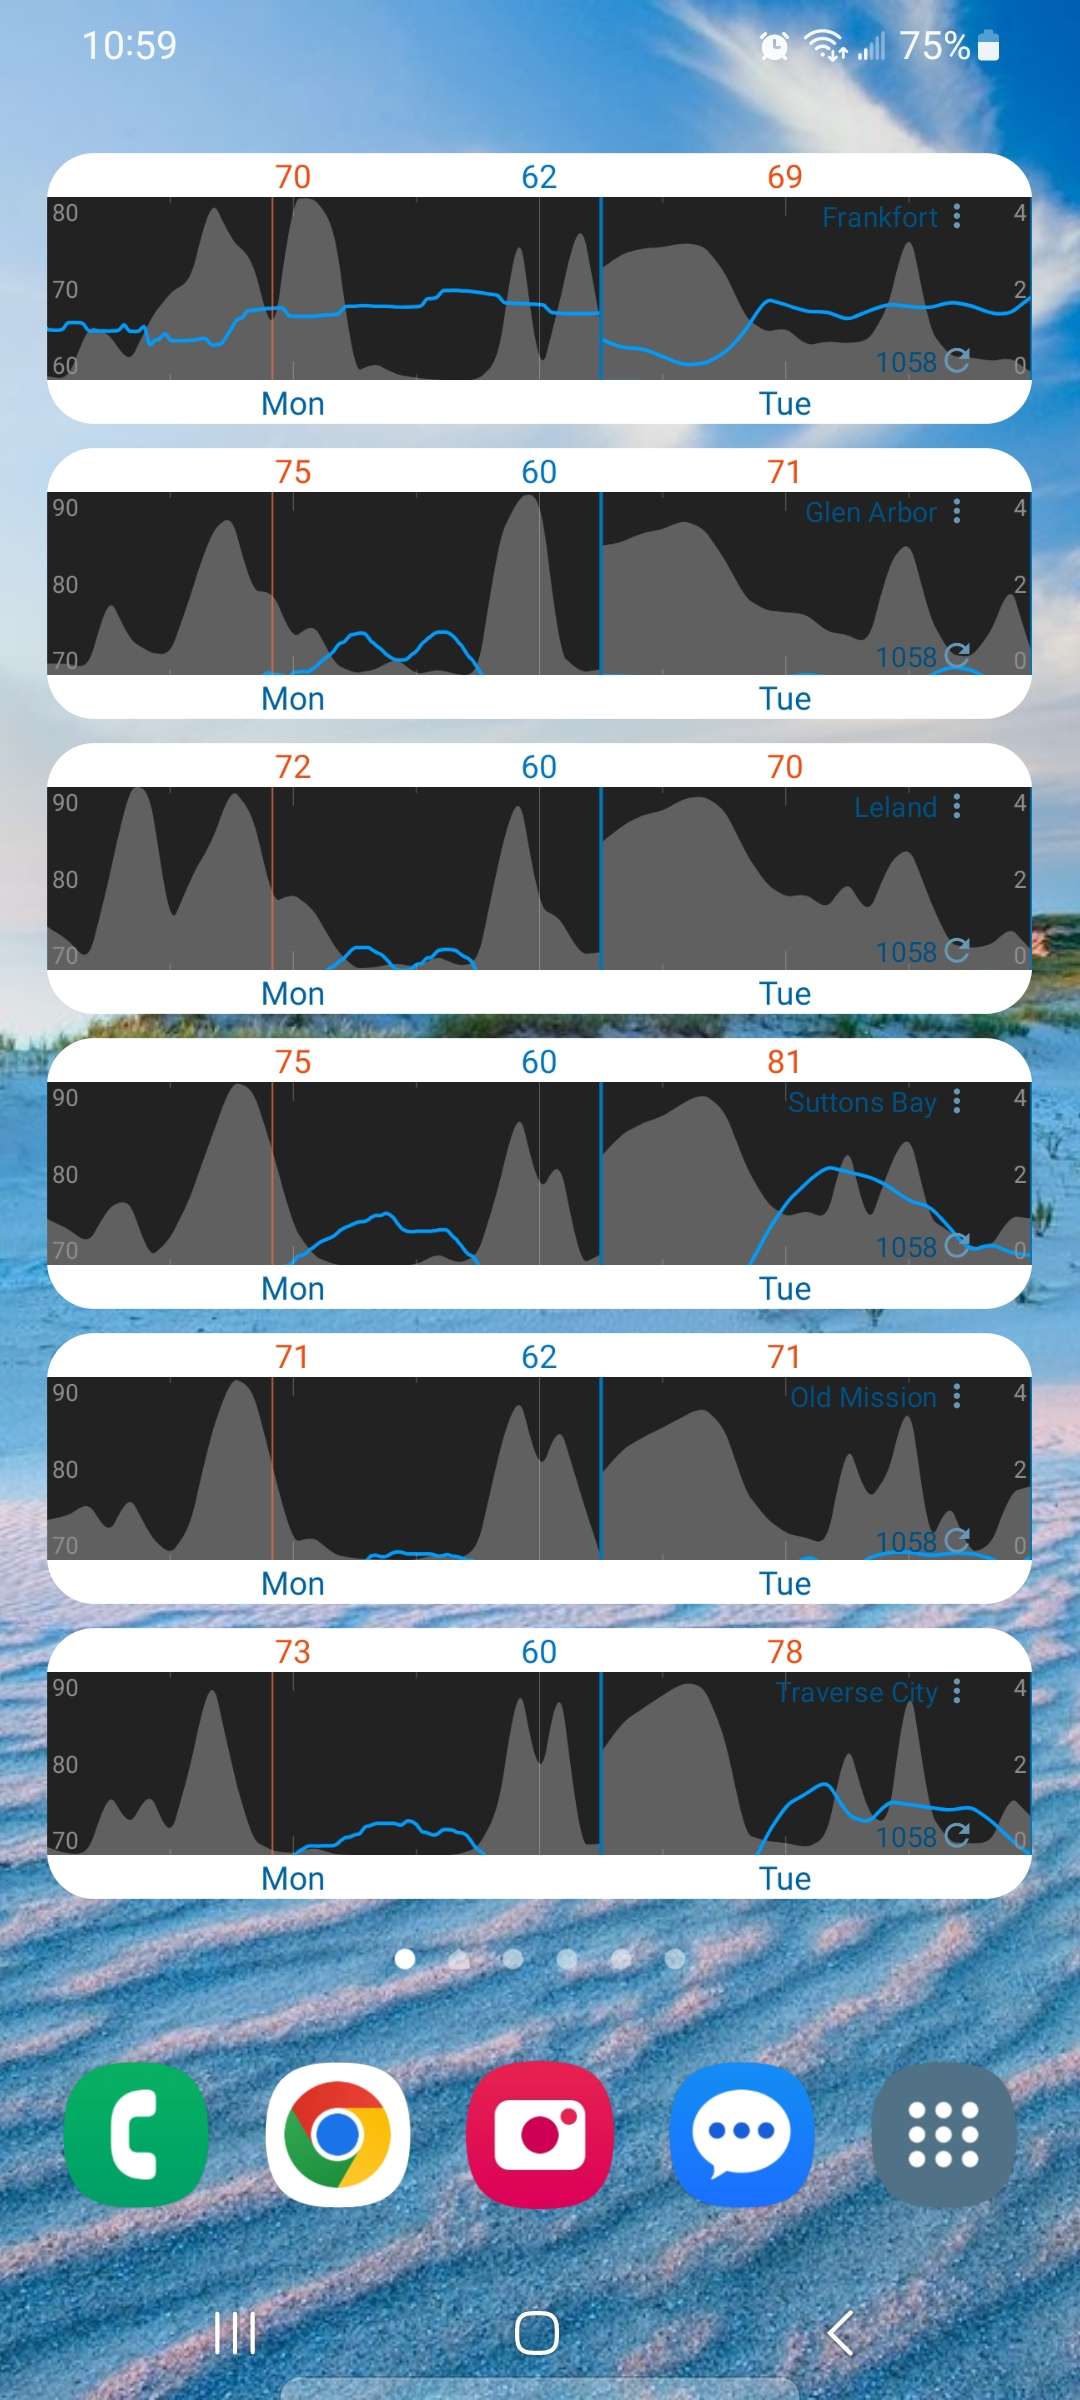
And I REALLY love the FlowX widgets! its given me the ability to create a whole panel on my S21+ to show ALL of the beach weather for Northern Michigan so my girlfriend and I can hit the right beach at the right time to maximize our limited beach weather in Michigan.