Hi,
Fantastic product
99% has every thing could want
Have uk forecast as good as it gets
However would like choice of the various cloud cover on the graph,
With overall it look grey all day when 95% sunny.
I would like I think to use low cloud on this.
The mains screen is accurate, but when combine low, med & high, nearly always at one level there is some cloud shown when in reality barely any cloud cover on the ground
You can add low/mid/high cloud layers via “Edit Data” in the top right menu.
NOAA includes high cloud in their total cloud calculation which I find can give the wrong indication of total cloud. GDPS has a better formula. But I do use low and mid cloud data a bit to get a better understanding of cloudiness.
I hope to add a better graph and map rendering options in the future.
Hi,
It is the graph that I was hoping I could change cloud cover to e.g. just low.
In Editor/Graphs there is only the option of total cloud.
I use Monkeys Wedding which is great, its just with total cloud cover it can give the impression of a gloomy day throughout because at any one time there might be a bit of high, med or low but in reality the Sun is getting through quite a lot of the time.
The main map display is very accurate, clicking between low, med & high is usually correct but a bit of high is still fine, then a bit of med still OK, then a bit of low still OK but on the graph looks like constant cloud cover.
Being very fussy as such a complete App, I can scroll through the time on the map and really see but I do use the graph a lot for a quick glance.
is “And maybe tone down Layer Opacity in Cloud Cover Default” referring to low, med or high or is there actually a setting I am missing.
I use Expedition Marine UK Sth & that is really very good for my location, 40 miles from the south coast so do not think can improve on that, I tried a lot of the others before upgrading & is variation good & bad but this mostly the most accurate, certainly for rain.
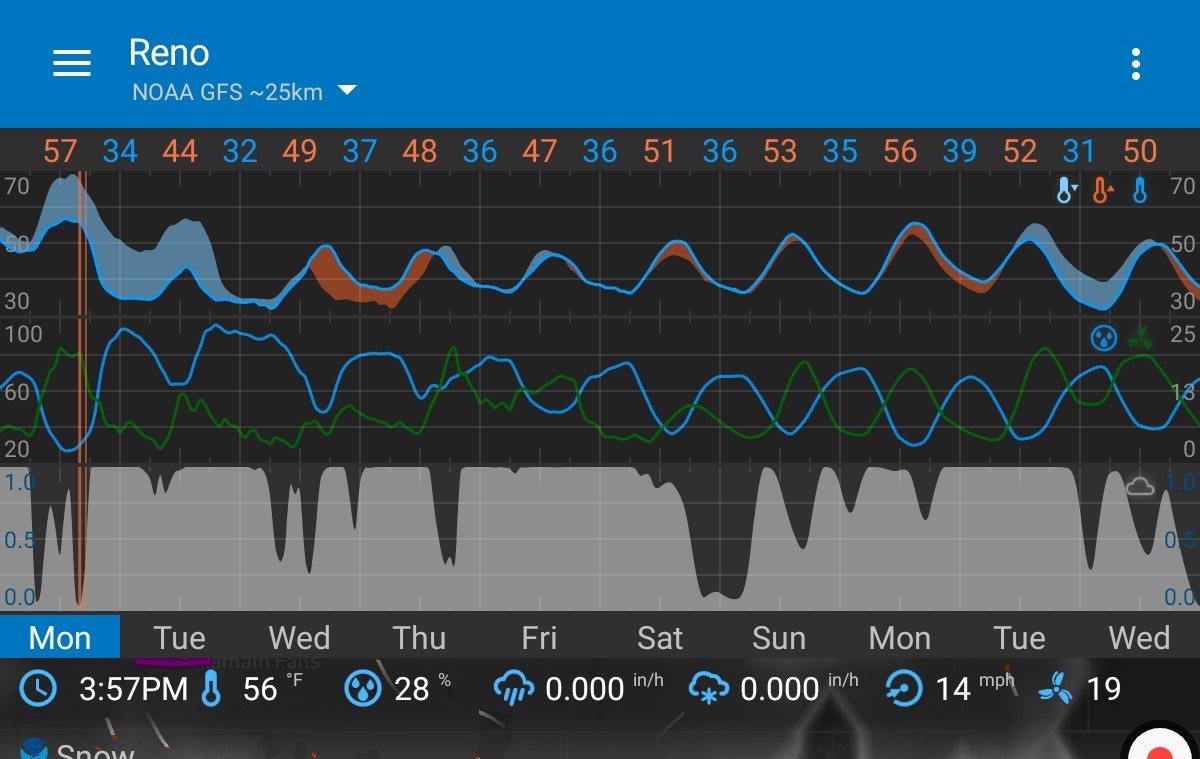
I see what you are saying @Bignose2 I added current screen shot of the graph as we are in between fronts it does show a drop in clouds as well as an increase in clouds