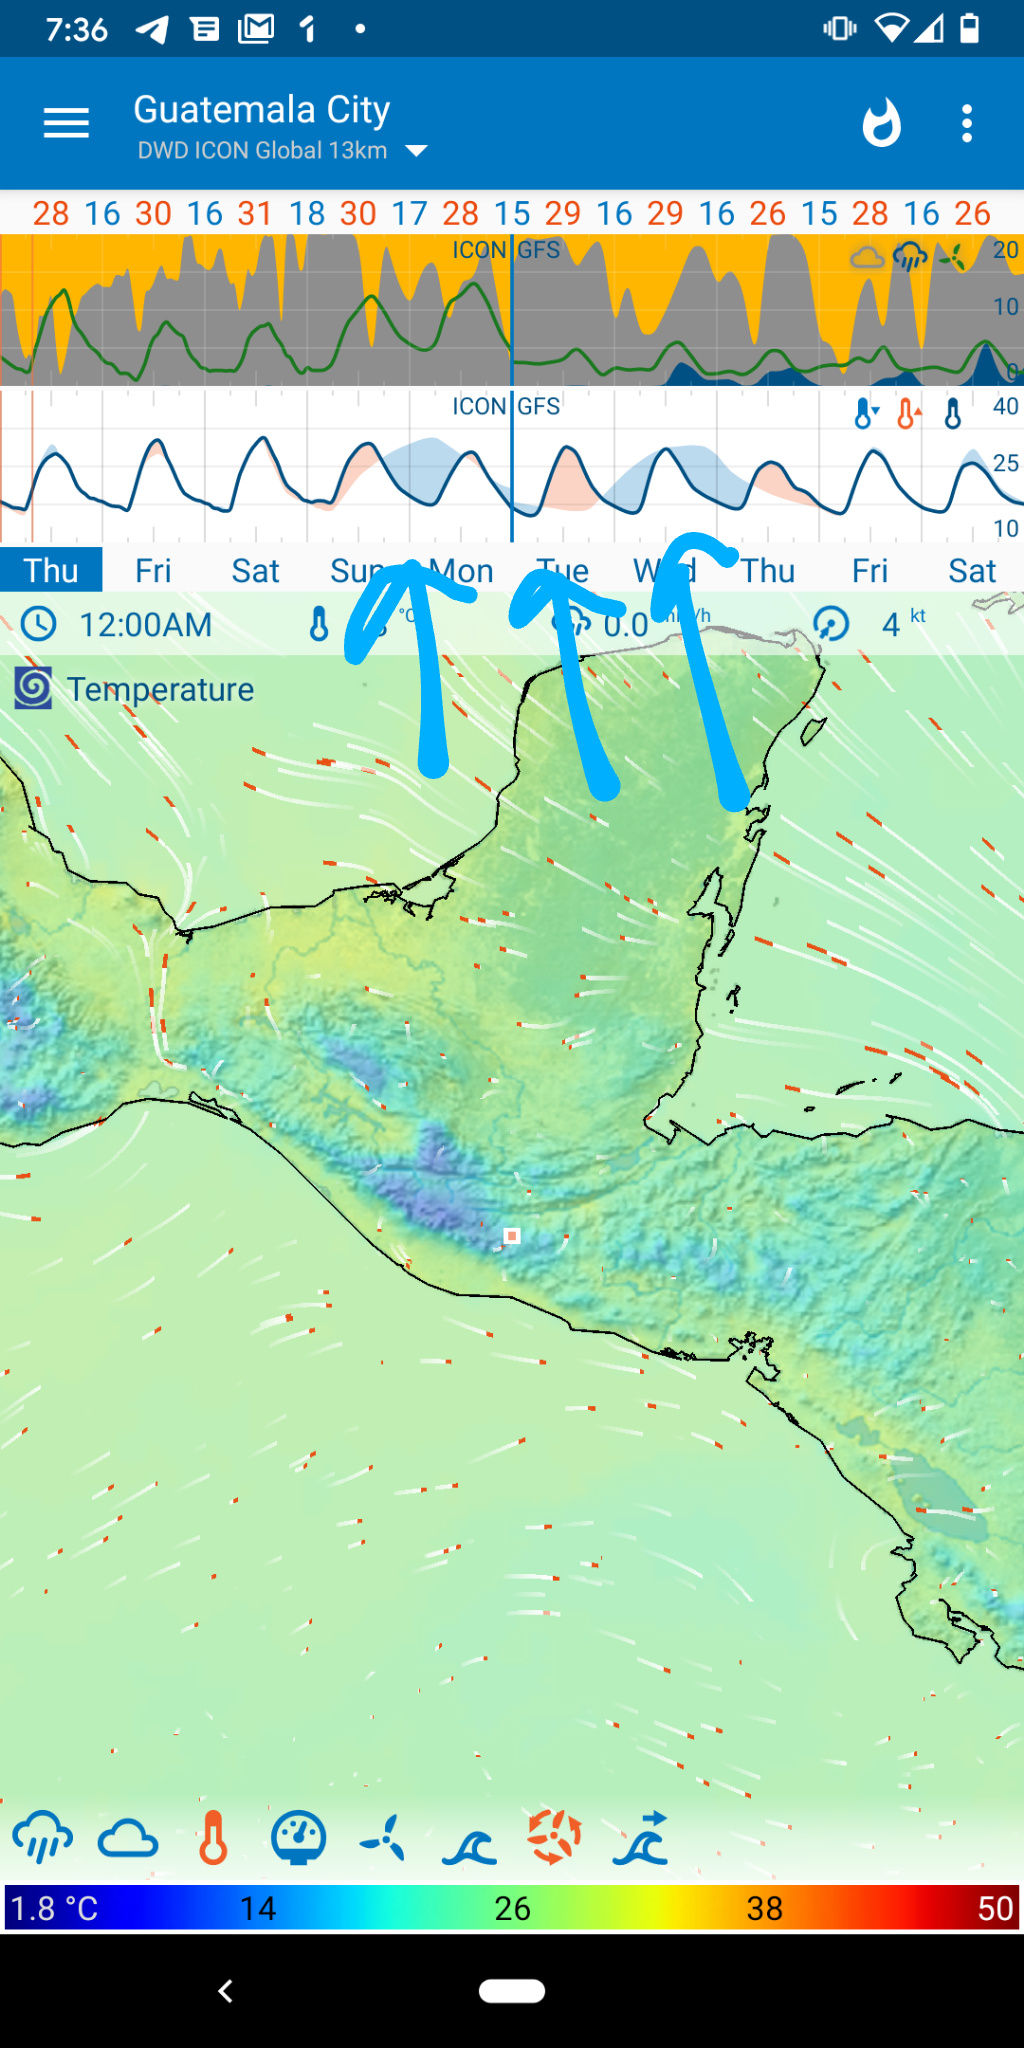
Hi I’m checking out the new features with the one-hour step of the GFS and icon I cannot understand want the temperature variation mean on the chart see screenshot.
When the cold front approaches I can see temperature changes in the future days. But the Chart shows big temperature changes (blue and red areas ) but is not consistent with the regular temperature line.
Can you explain what’s the interpretation of this colors
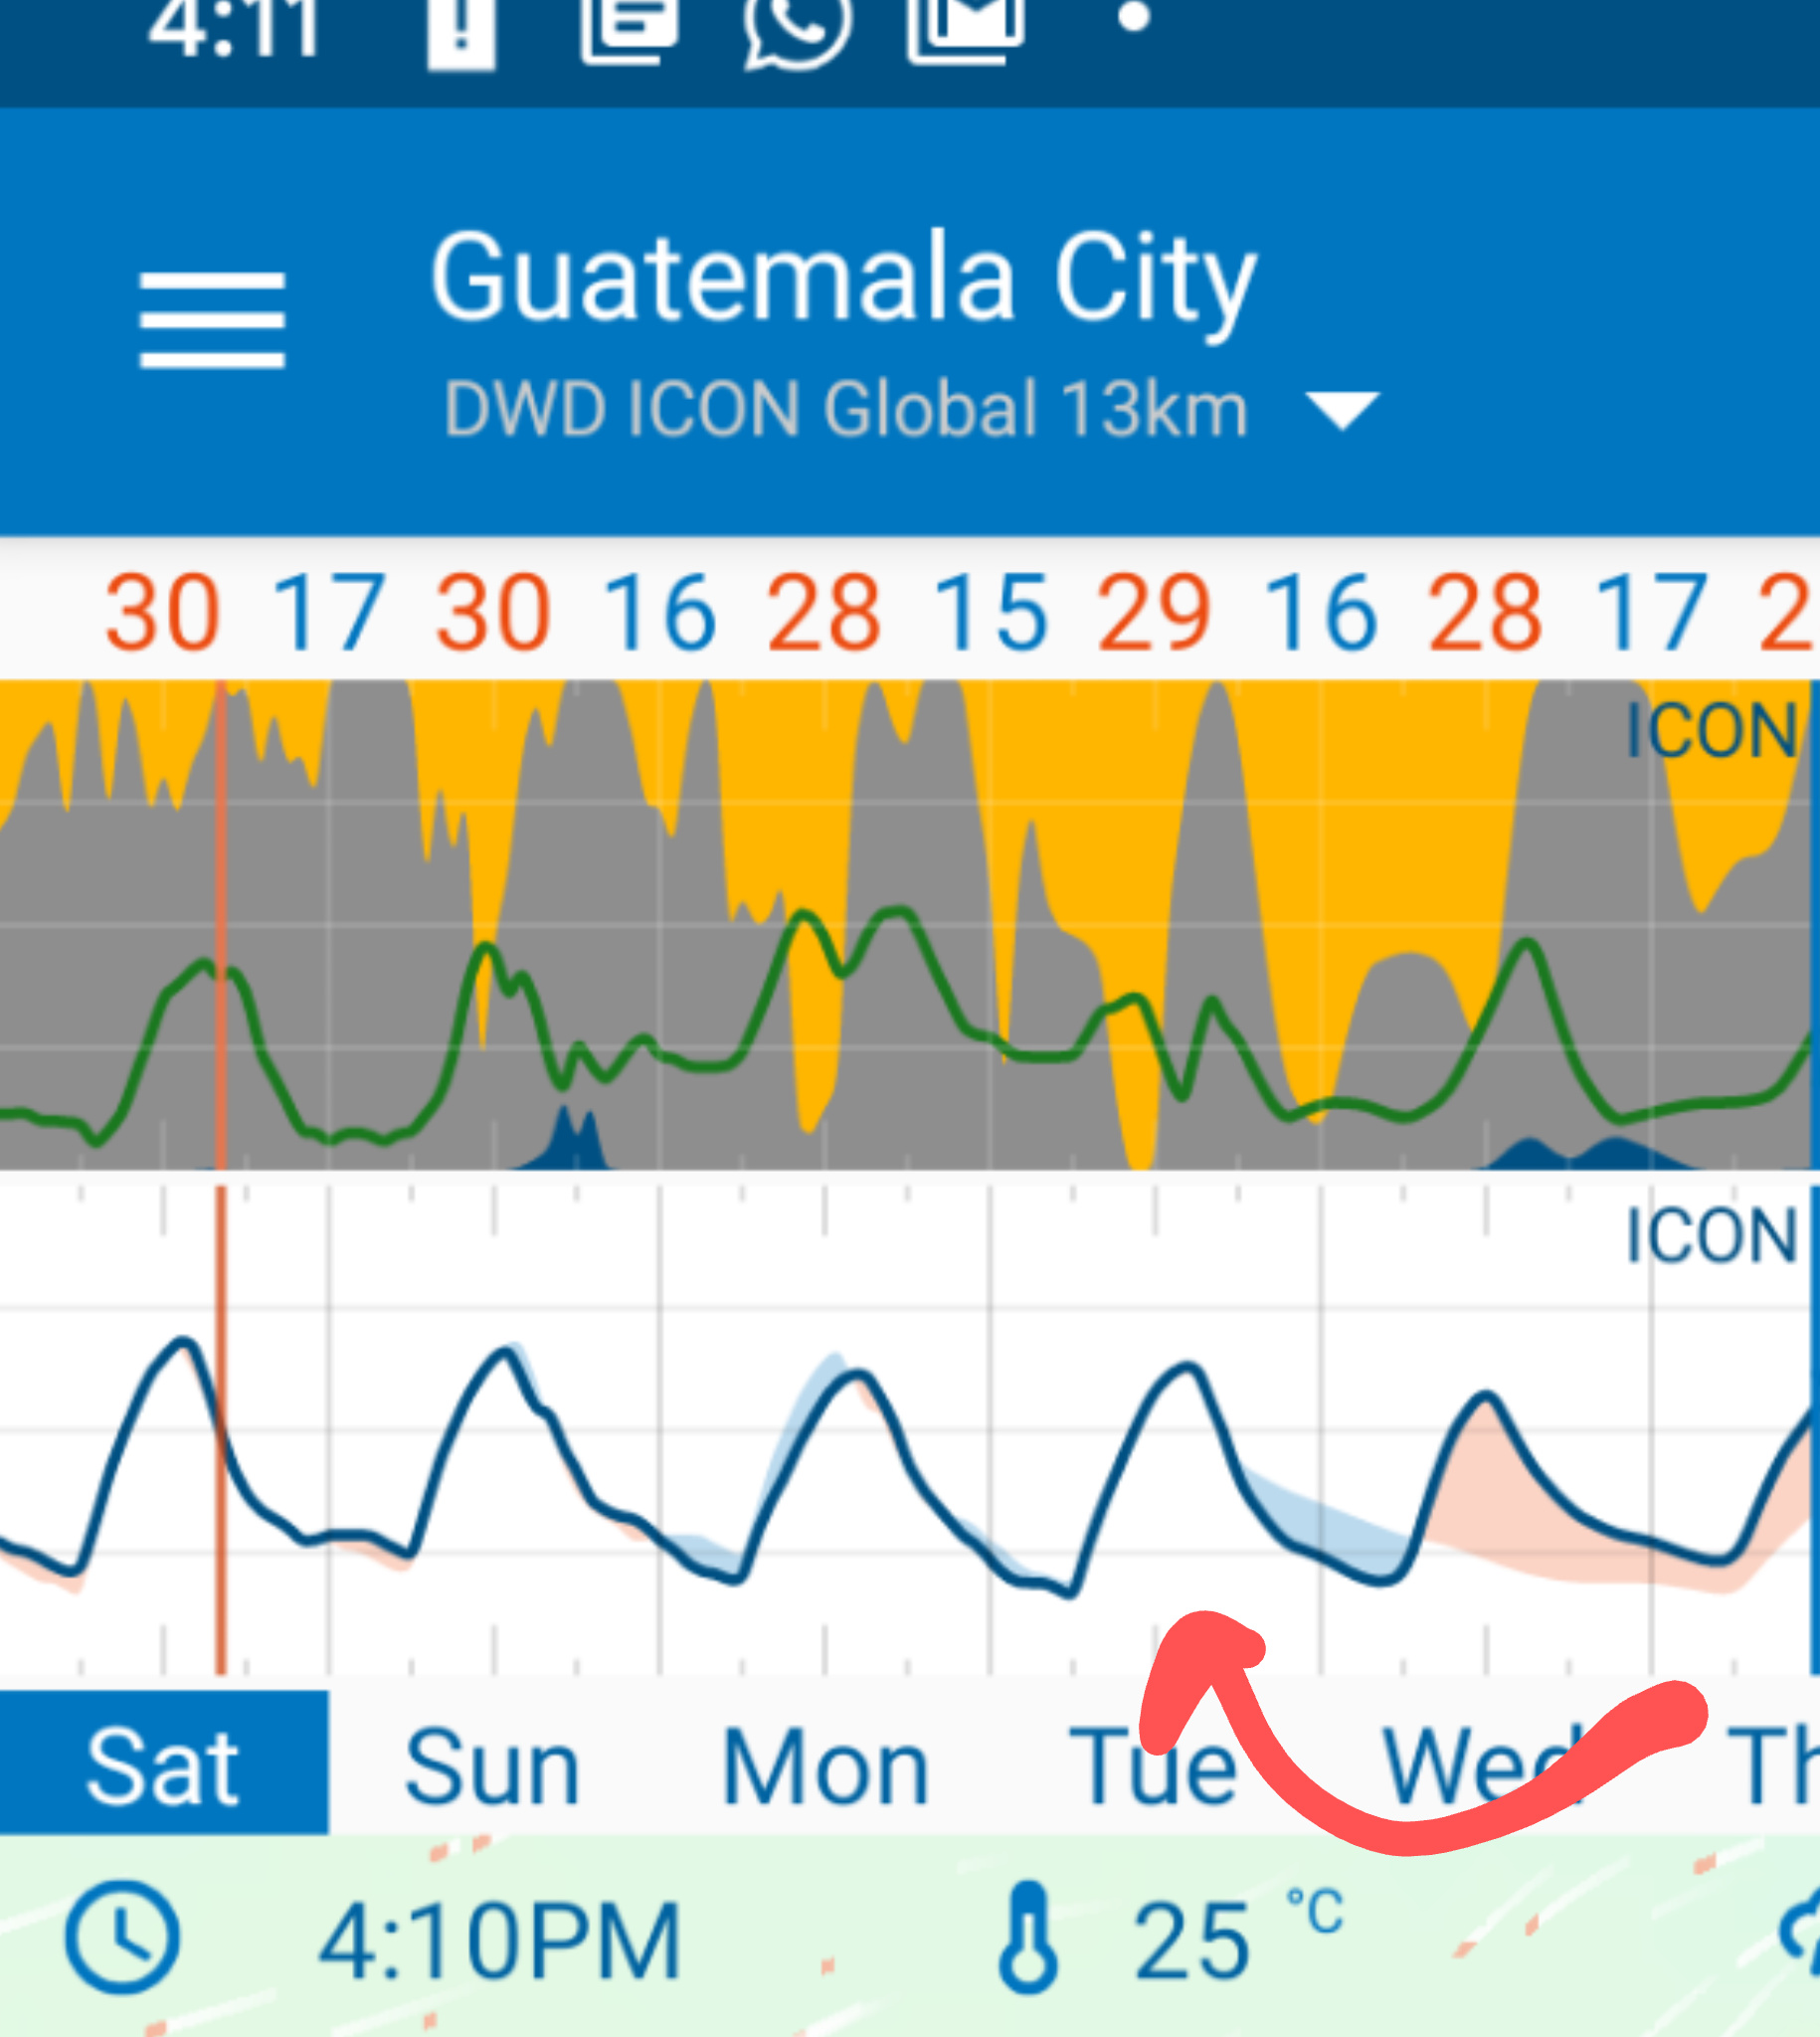
Hi Bryan, thanks, I understand that, is just that does not make sense, if you see the temp line, for prior 24 is not the value of the red / blue areas, in other words
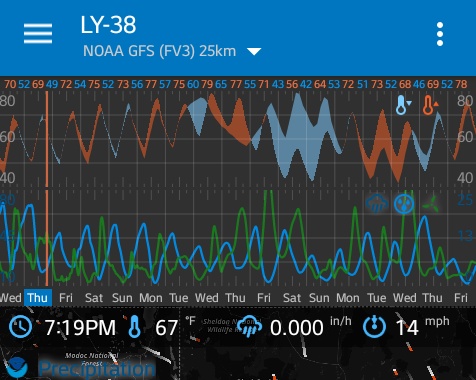
No cold of warm front on the forecast, did you check the image ?
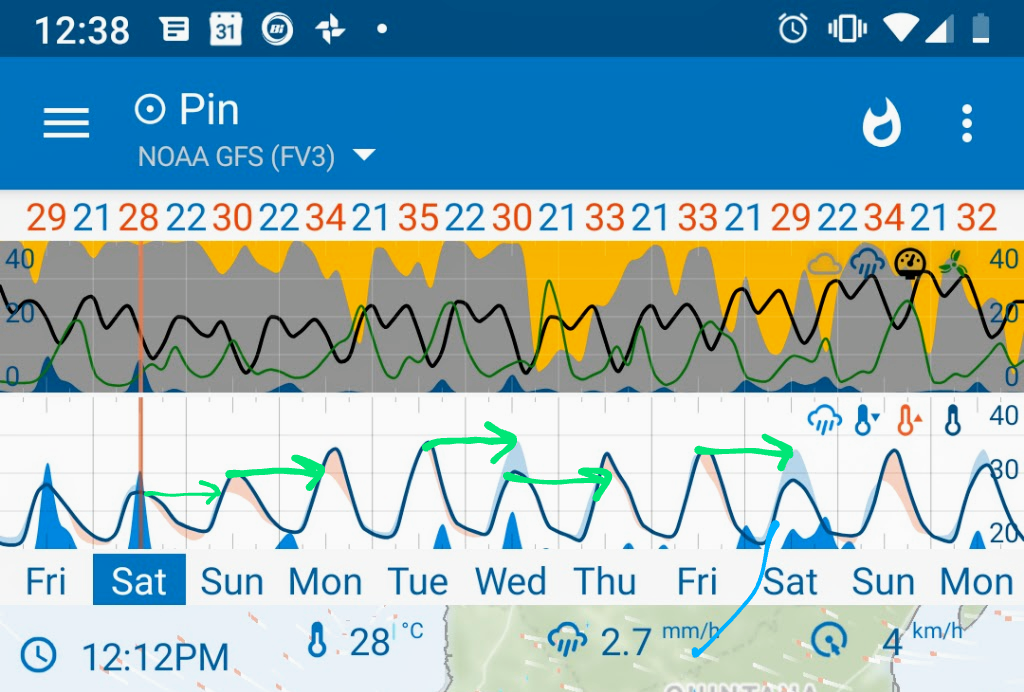
In your screenshot @BrianLY-38 the bug is eaven more clear.
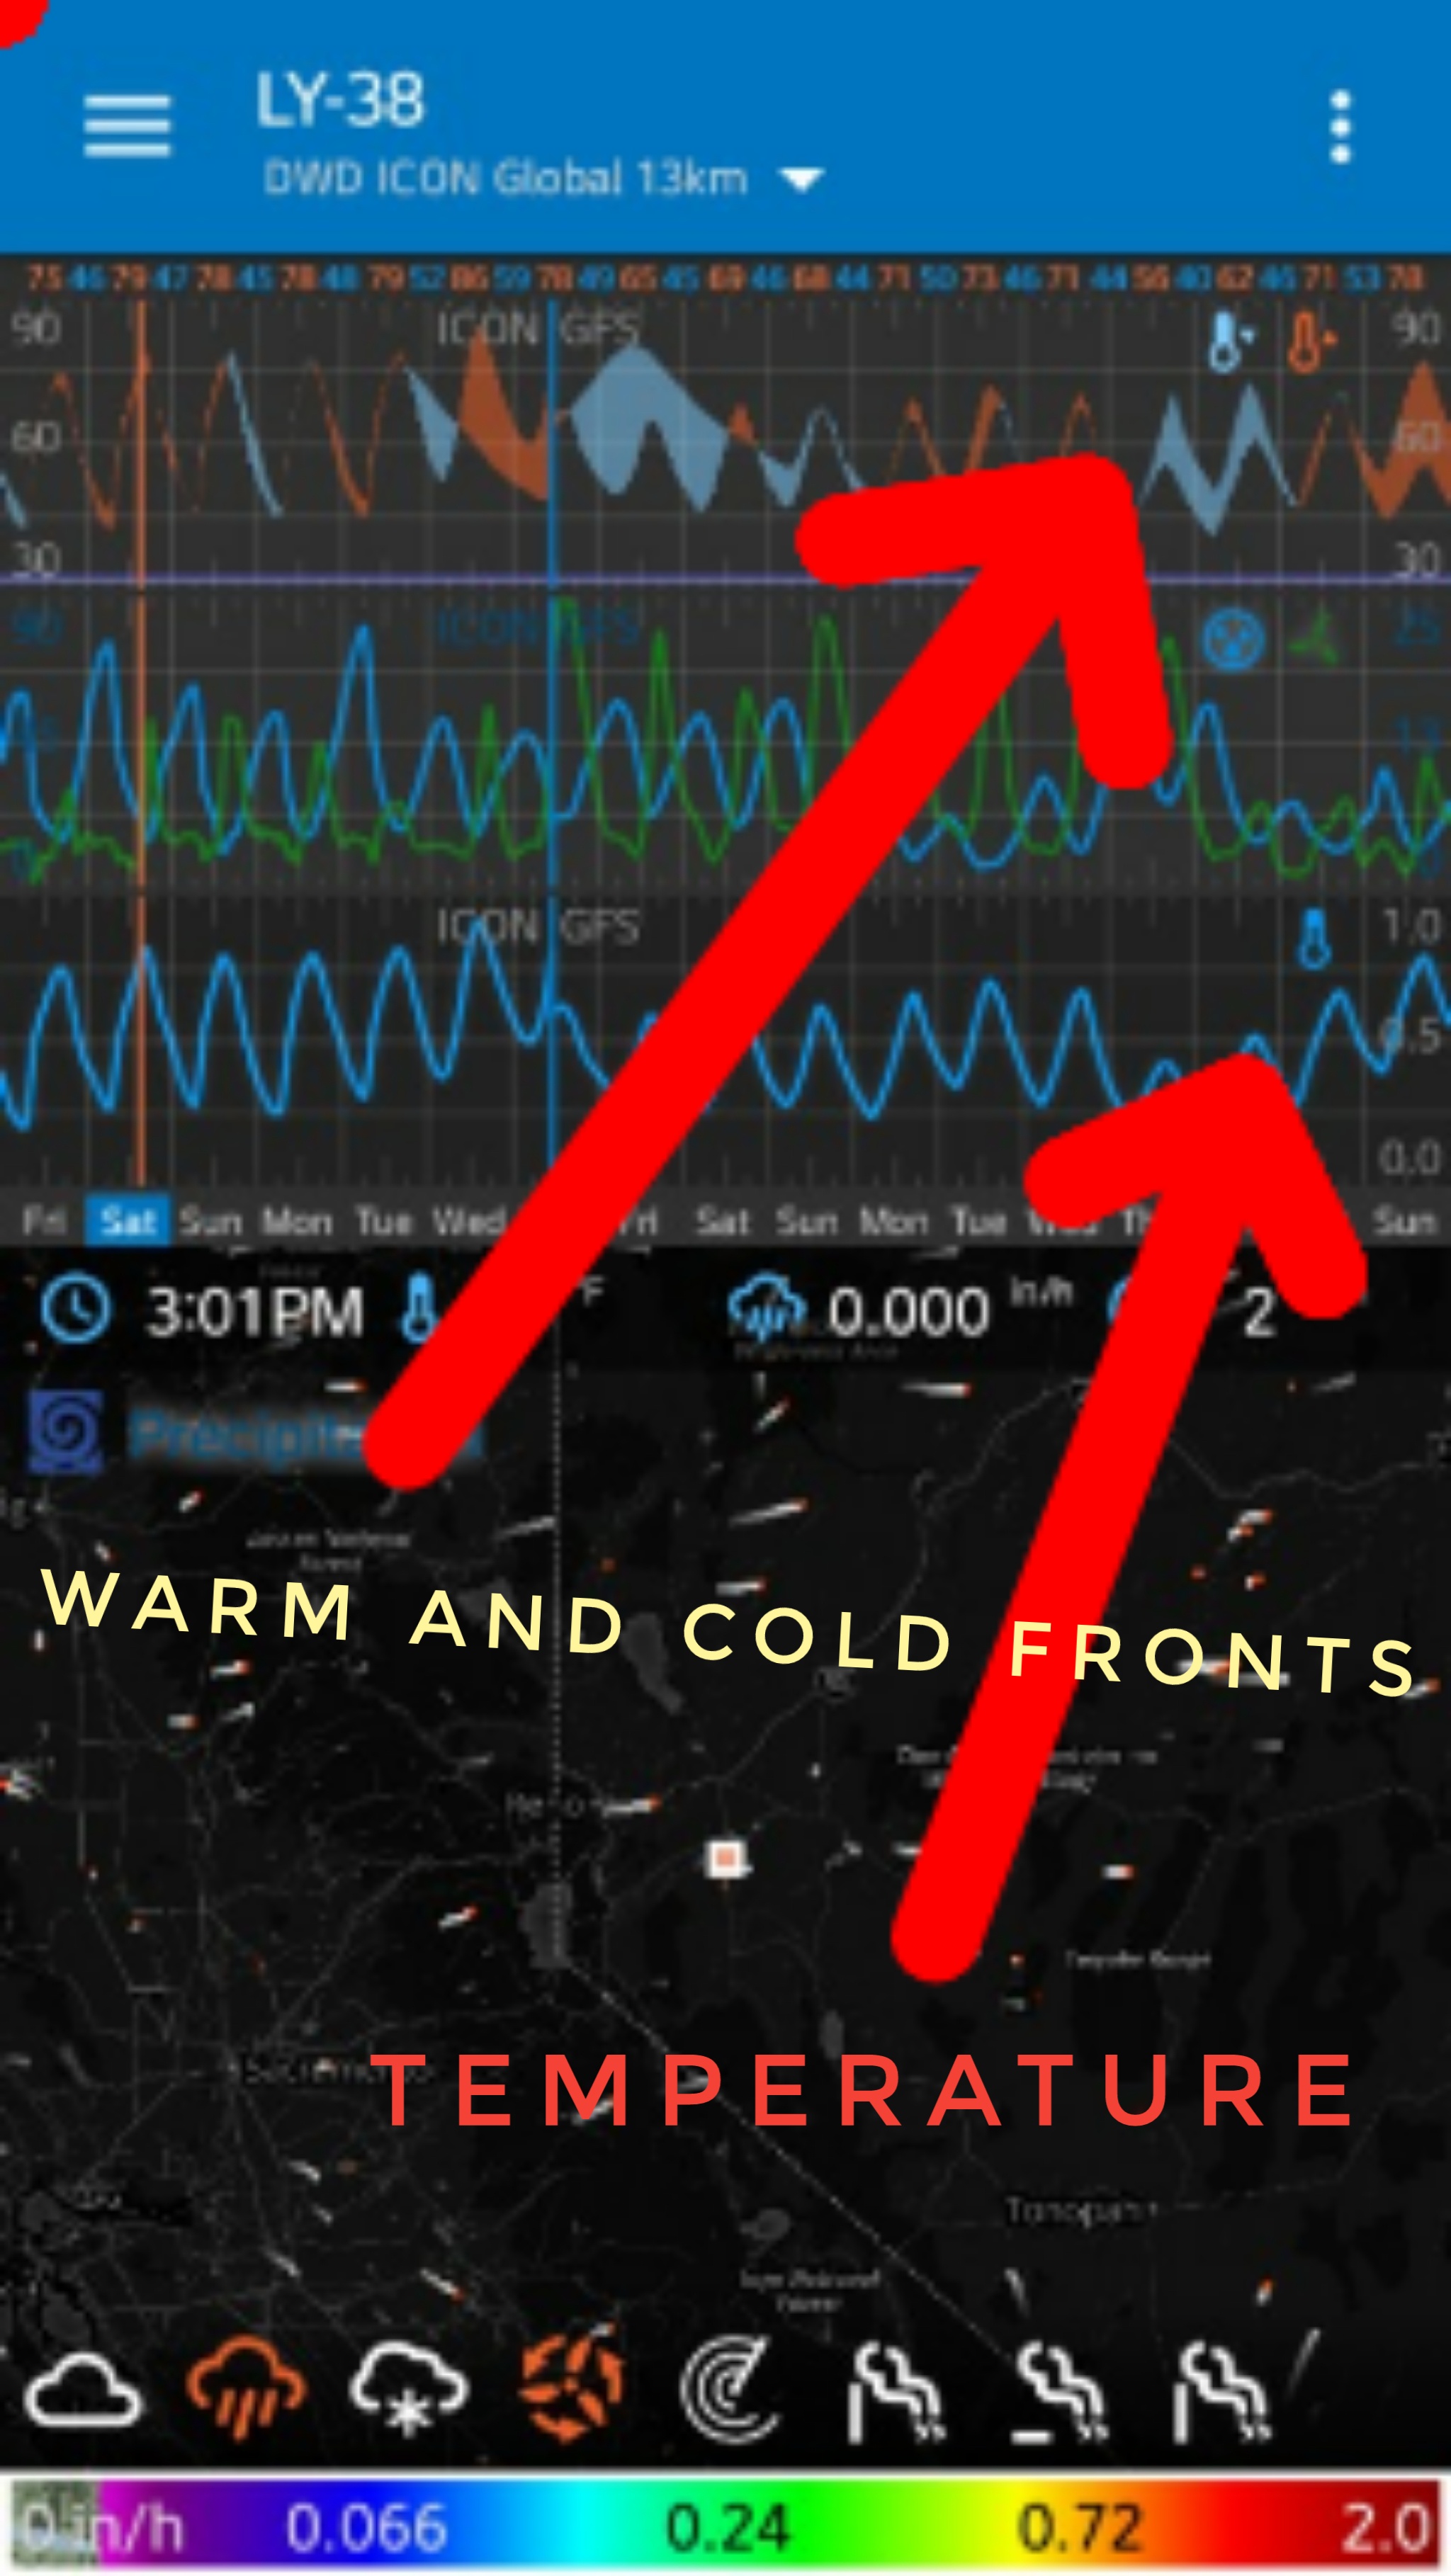
If looking in the big blue area, and the red area to the right, is seams as if the temperature that the graph is compared with is 3 days prior rather than just the day before.
and by @BrianLY-38 is that in the example by @neavilag the data in the graph is from two different sources, and is seams as if the temperature in red/blie is being compared to a completely different graph, perhaps from a different source.
“Cricket Chirps - this is the which shows the temperature (blue line) along with cold (blue) and warm (red) changes compared to the same time on the previous day.”
So what is being discussed here is a bug that leads to the DeltaTemp graph not being compared to the same time on the previous day, but instead to something else.
In some examples it seams to be to the the same day 3 days earlier, and in other examples to something completely different.
@neavilag when you have temp selected along with warm and cold fronts when it’s a small warm or cold front the temperature line covers them that’s why I don’t have temp selected.
Delta temperature shows the change in temperature from the same time the day before. This is good at highlighting changes in temperature, i.e., getting colder or warmer, which is often caused by warm and cold fronts. I’m guessing there are other weather phenomena that will cause changes in temperatures.
There is definitely a bug.
Before, GFS had a constant 3 hour time step so I would subtract the temperature form 8 time steps (8 x 3hr = 24 hours) prior to get the change in temperature.
Now, GFS has both 1 hour time steps and 3 hour times steps after 5 days of data but I assume 1 hour time steps all the way through when calculating the delta temperature. This is why you see the bug after 5 days.