I would like to have the ability to build a fully customized forecast graph for the top of the screen. For instance, i mainly view the temperature graph and the precip part of the “Everyday” ant turn the rest off. But this entailes having two maps open. It would be nice to build a customized graph with just those parameters.
2 Likes
Long-press on the graph and “Edit”
1 Like
@jonaroberts you can just tap and hold the graph select add add what you want
1 Like
Thanks. I knew you could do that, but the list of things you can add doesn’t have a precip option to add.
2 Likes
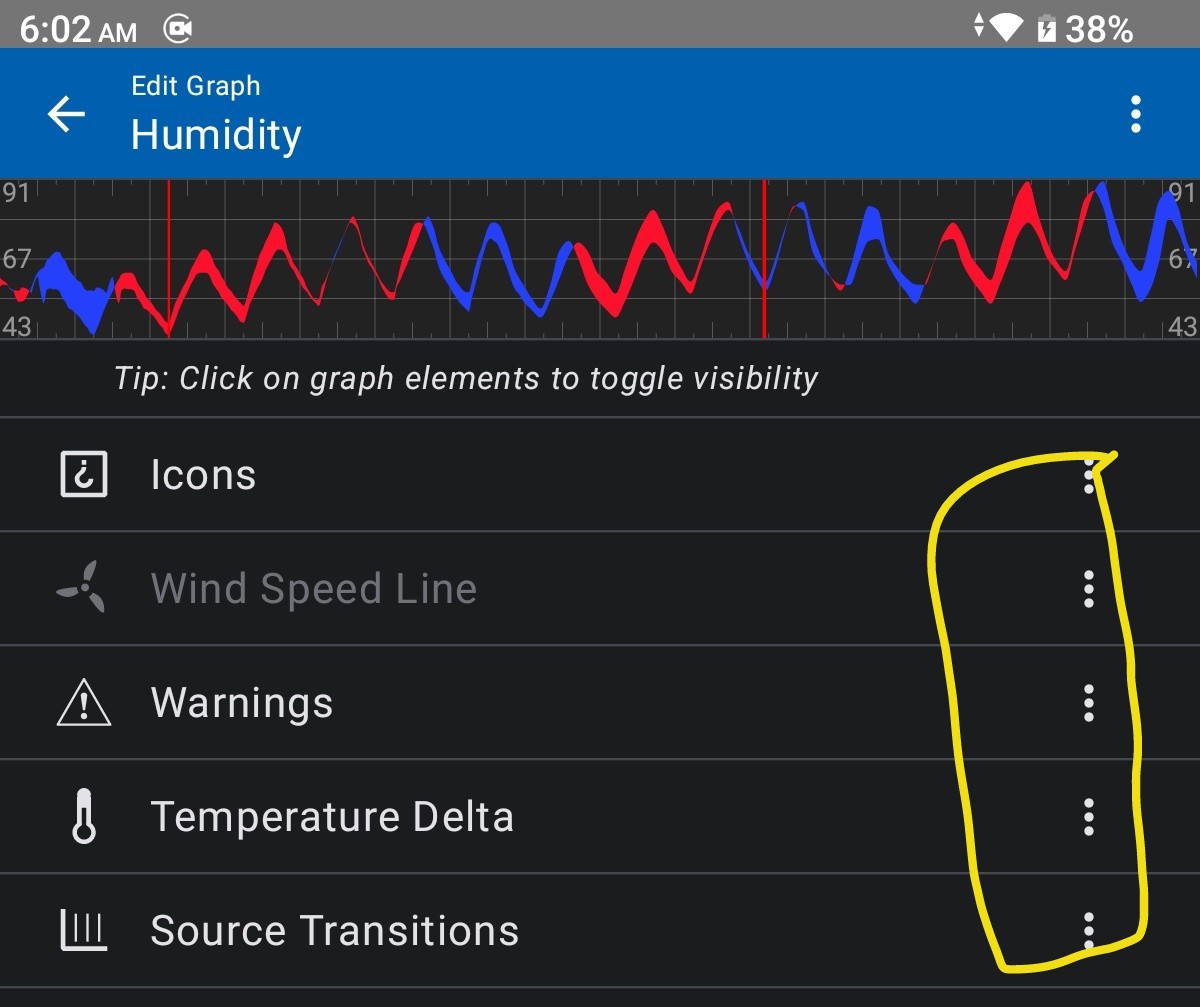
Did you click on the “3-dot menu” on the right of a graph element and select “Add”? Precipitation should be the first option.
2 Likes
Tap Hold Graph then select edit then select 3 dots(Pic) to the right of list then select add 1st option Precipitation
1 Like
@jonaroberts: You can choose between “Temperature Line” and “Temperature Delta” using the attribute Plottype which appears after clicking Add in the 3-dot menu and then clicking Edit. If you want to activate both “Temperature Line” and “Temperature Delta”, then you have to add the Temperature element to the graph twice and select one plottype per element.
2 Likes