For a 10 day forecast I would like to have:
MetroFrance ARPEGE (first 2.5 days)
DWD ICON Global (next 2.5 days)
NOAA GFS (last 5 days)
Is this still possible?
I’m getting a little confused. This may be a misunderstanding. Can you email me with the debug log?
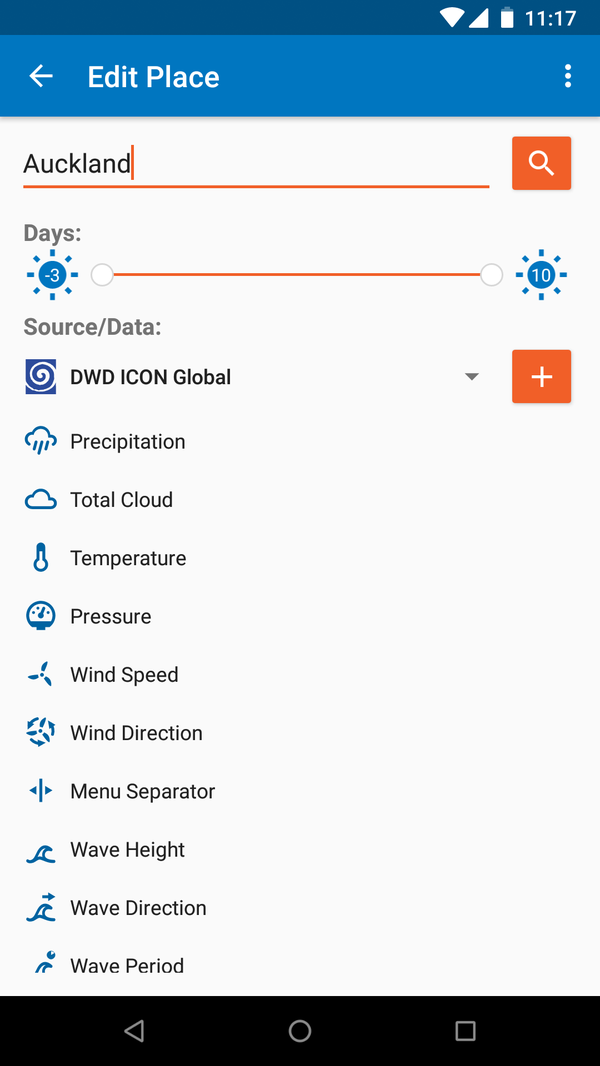
Originally, you had to choose a data source for a place but for the last 6+ months, this choice was moved to the drop-down menu on the main screen with the map. Hence, the redundancy in the “Edit Place” screen.
Since version 3.228, I removed the source option in the “Edit Place” dialog since it did nothing.
I could easily be mistaken but was thinking back to over 6 months ago, I thought I was able to have more than 2 data sources on the graph at once. I simply wanted to check whether I am dreaming or whether the new drop-down method has now limited it to 2 for a simpler user interface.
Either way, do you think it would be possible to have 3 data sources on the same graph - or does this sound too tricky to implement?
@jolley single data source but you can press and hold graph when option list opens select “Compare” then you can view multiple data sources to compare them.
Actually not a single data source, on my 10 day graph it shows two, the selected one and a longer range one:
MetroFrance ARPEGE (for the first 2.5 days)
NOAA GFS (for the next 7.5 days)
I’ve not used the compare feature before so really glad you told me how to do it. It’s a great feature and works well. Well pleased.
@jolley just realized what you were saying yes depending on what you select it will show multiple because some data sources only show data for a short number of hours/days
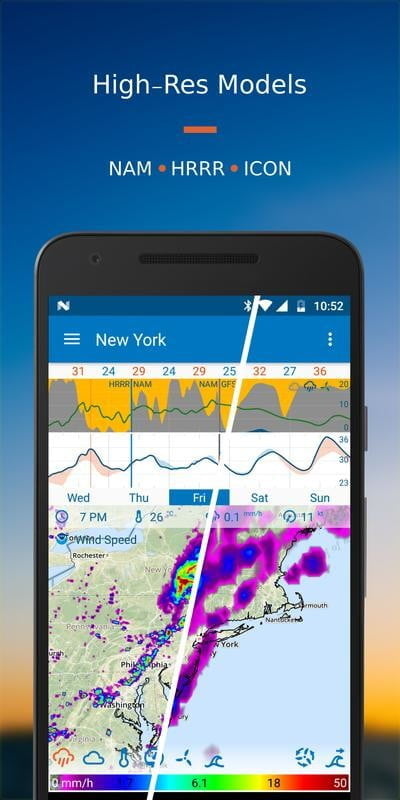
Just found this somewhere online, I guess this image is well outdated but shows what I was trying to explain to start with - see how there are 3 data sources on the same graph?
Sorry I think you may be missing my point - it’s not about the specific data sources, it’s about showing more than 2 on a graph. The image above shows 3. It looks like there’s 1.5 days of HRRR followed by 1.5 days of NAM followed by about 2 days of GFS. I’m not sure whether this is possible to do in the current version of the app even if you have Gold subscription?
In my case I was enquiring whether I could configure my 10 day graph to have ARPEGE, ICON Global and NOAA GFS on the same graph.
ARPEGE has 2.5 days forecast (use this for day 0 to 2.5)
ICON Global has 5 days forecast (use this for day 2.5 to day 5)
GFS has over 10 days forecast (use this for day 5 to day 10)
I am really enjoying Flowx and recently switched to the gold subscription.
The more accurate models are great, but what I am missing very much is exactly the feature described in this forum.
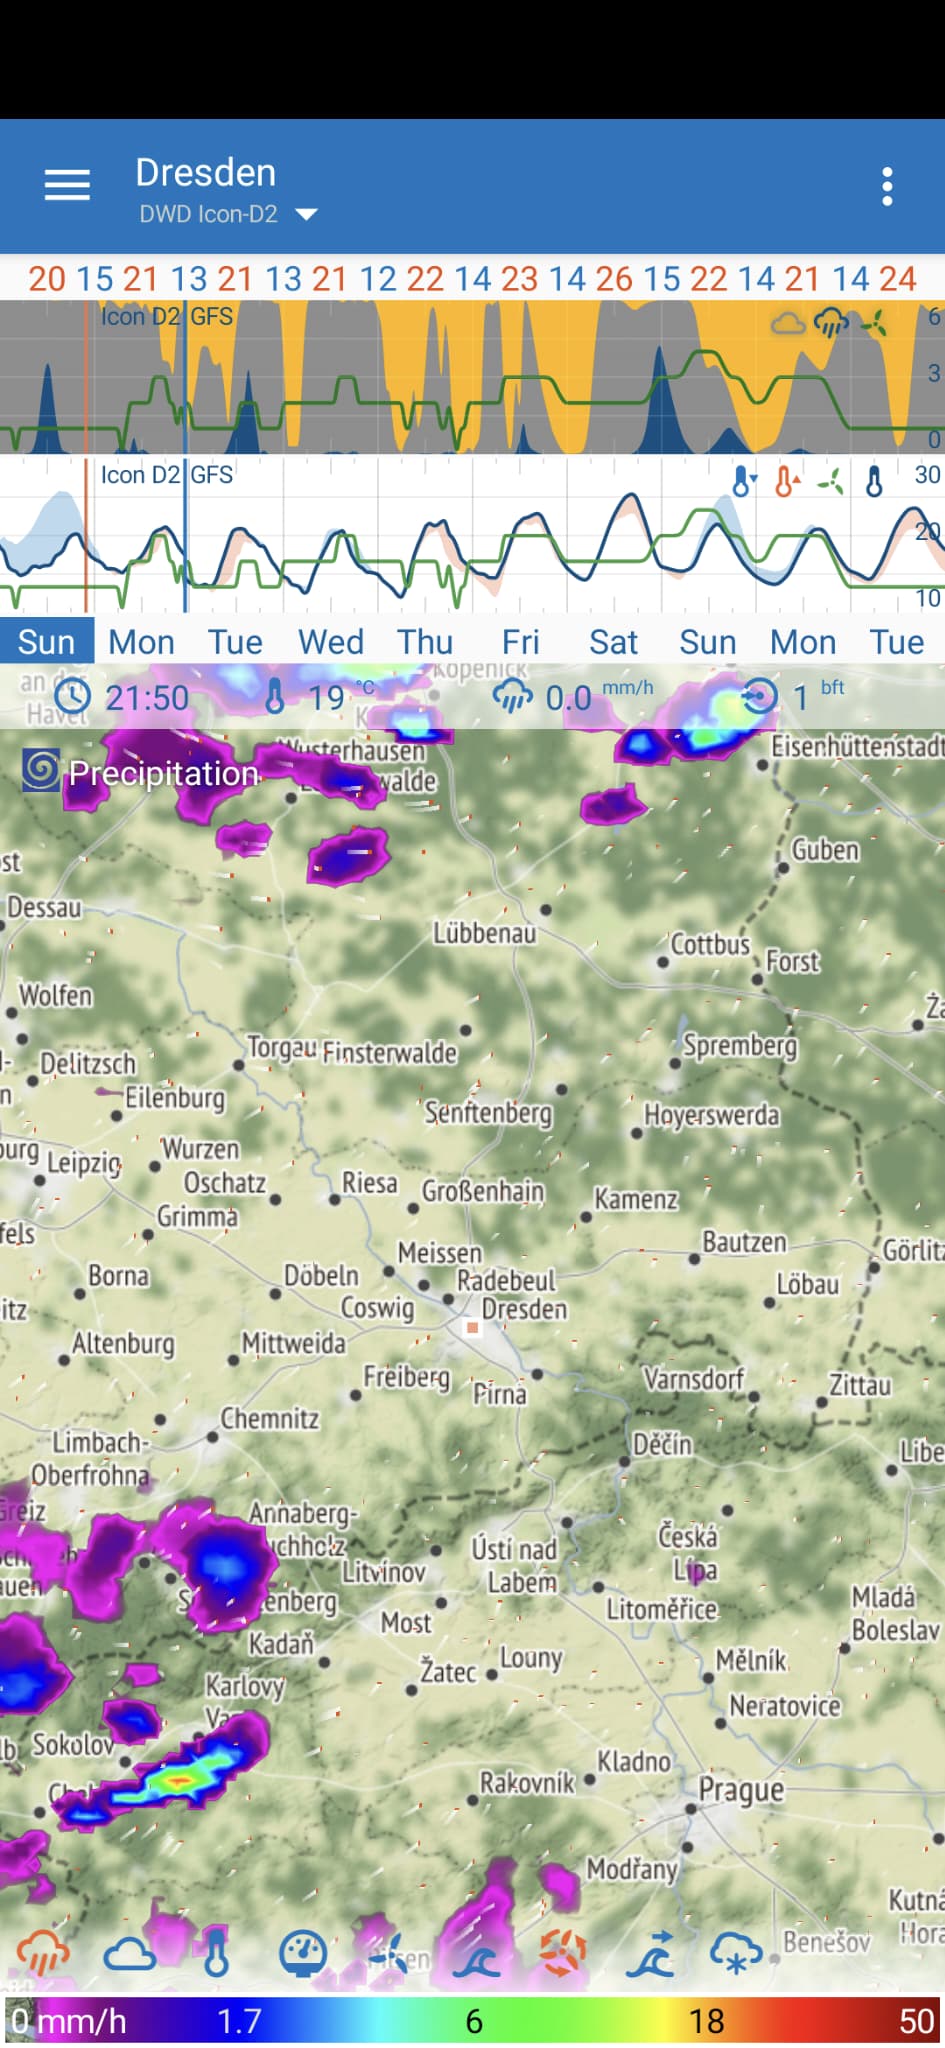
I first did a gold trial in the Netherlands where the KNMI Harmonie gives a 48 hour prediction which is ok, but I spend most of my time in Germany where Icon-D2 has a 27 hour range. Therefore I only have the accurate prediction shown for one day and for the rest it defaults to the more inaccurate GFS:
This really takes some of the joy of the gold features away for me. I could switch between models manually, but that is not the quick and accurate overview I’d like.
What would be a great feature would be to mix ICON-D2 (27 hours)| ICON EO (5 days) | GFS (10 days). I couldn’t find the Cosmo-D2, ICON-EU and ICON mix you mentioned earlier in this thread.
Any help on this would be greatly appreciated. Cheers!
This is what the datasource editor feature is for, you can setup your own mix of data sources. But this editor is not easy to add because the backend code is not setup for it. I’m currently doing a big re-write on the code to allow this in the future.