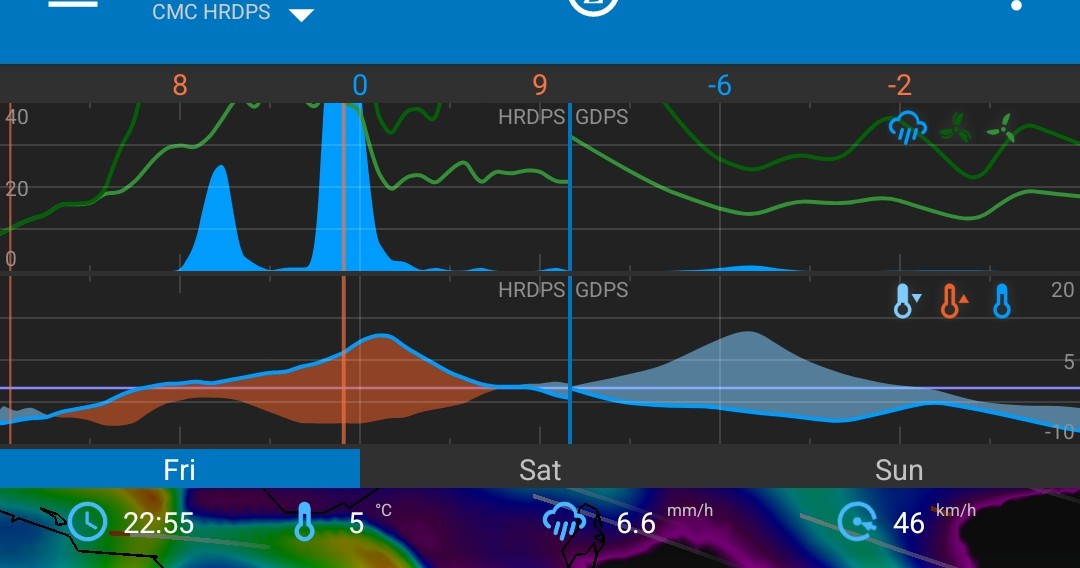
See screenshot, the wind gusts line graph up top goes off scale completely. I wonder if there’s a way to manipulate the vertical scale and fit the data?
2 Likes
4 Likes
“Set Range” is what you are looking for.
Long-press on a graph to access the graph menu.
Set Range allows adjustment of the data range.
2 Likes
I was in Moab Aug 2024. Wind velocity was in the mid teens+, but gusts were 20+ to 40+.
I had no range set for Wind, yet the gusts were off the chart with the scale max at 20.
2 Likes