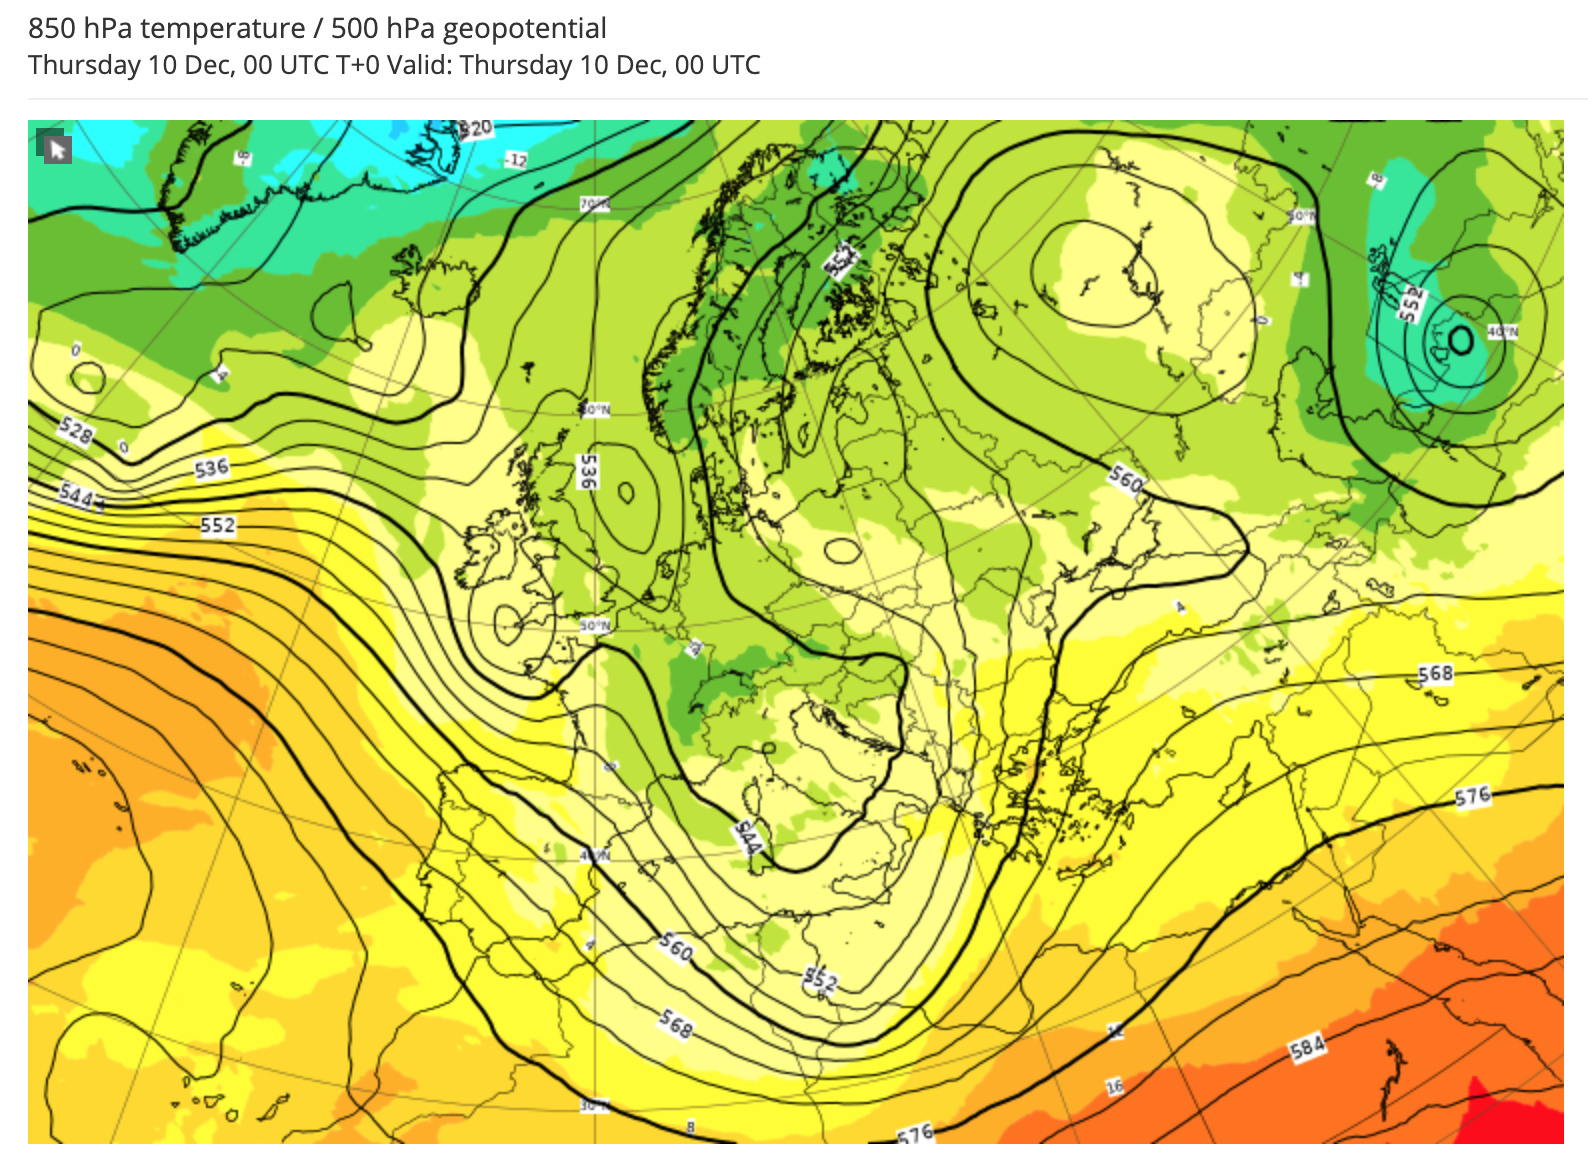
Would it be possible to show pressure values as contours instead of (or optionally in addition to) a colormap? Like how, for example, ECMWF and many other resources show pressure values:
I find Flowx’s pressure colormaps (particularly the smooth gradations in color) to be very hard to read and use, even with my degrees in atmospheric science. But with contours as shown above, one can actually see the structure of the high and low pressure systems and if one knows about geostrophic balance then they know the direction of the winds too. Contours also have the benefit of playing nicely with other data too (like the temperature + pressure above) so that it’s possible to show multiple fields of data at once.
I don’t think this would be hard to implement, just a different choice of plotting scheme for the same underlying data. Even if it were not possible with whatever code you’re using to have labeled contour levels as shown above, it would help readability quite a lot to have lines distinguishing different contour intervals instead of only the smooth color gradations between values.
Being able to edit the colormaps certainly improves clarity, especially using the colormaps with steps or the “pressure steps” option!
Though it’s actually still unclear to me how a colormap with steps is any different to implement than a contour plot? The color patches indicating intervals/steps would just be replaced with lines instead. It would also be very similar to what you’ve already implemented with the moving wind vectors, except the lines the vectors follow would be static at each time step instead of dynamic. In my work I make atmospheric plots and movies almost daily, so from my background it seems strange that it should be any different, but maybe there are some subtleties for this application that I’m not aware of?
Rendering in Flowx is done on the GPU using shader languages so when you swipe it renders at 60 frames per second. You are probably generating static images using a library that uses a standard method (I forget the name) generating isolines. This standard method might be able to be ported to the GPU but it won’t work with swiping - it’s too slow.
Long story short, this is a highly requested features. I’ve thought about it for years. It’s not easy