Pro Version not good In Sydney, Australia

Hey Duane and fellow flowX team members

I recently subscribed to the pro version and tbh, it has been less than impressive in Sydney, Australia. Case in point… Today and yesterday there were 2 massive storm cells over Randwick (Suburb of Sydney) and the pro version didn’t register it at all, even on rain radar after the fact lol.

Now I know you guys are hard working so will give you guys the benefit of the doubt… but yeah so far I am a little disappointed. Perhaps you guys can focus on the Sydney Australia area for a couple of weeks for some improvement for me :slight_smile:

Keep up the great work
Best wishes
Andrew

3 Likes

@Lockscombi Hello and Welcome to the Forum and Thank You for Using Flowx. Very Strange App is From down around your neck of the woods

1 Like

Hi Andrew,

Which weather model are you referring to? Can send a screenshot of what you were looking at? You can add days into the past via Edit Place in the top right menu.

Cheers, Duane.

2 Likes

Hi guys

Here is screenshots of what I use on pro version in Sydney, Australia


2 Likes

I thought rain radar is suppose to be very accurate about rain in the past but was totally bewildered that it didn’t pick up heavy rain last few days that lasted a good 30 minutes at least

1 Like

I can see high radar reflectivity at 12-4pm on Thursday and at around 7pm on Friday.

I’m not sure if you’re joking but you might misunderstand what “we” do here at Flowx. There is no Flowx team, there is just me. I don’t record the radar data nor do we solve the weather models. All I do is download the weather data from radar sources (RainViewer) and weather simulation results, process them and present them in Flowx. So I can’t really focus on Sydney to improve downloading and processing the data there.

RainViewer downloads radar data from many sources around the world and aggregates them into one source. I suspect RainViewer is downloading radar from the BoM website. I doubt RainViewer does any processing of the radar data that would change the result.

2 Likes

It’s also hard for me to comment on what you’ve seen without the times the rain happened and what you were looking at on Flowx.

2 Likes

All weather models predicted a lot of rain on Thursday. Less so on Friday.

2 Likes

Hi Duane

I have found the silver package (Global weather model) to be far superior to the pro Sydney exhibition model

Perhaps I will just go back to that model and ask for a $10 refund? I’m more than happy to stick with silver global models for my lifetime

1 Like

Hi @Lockscombi,

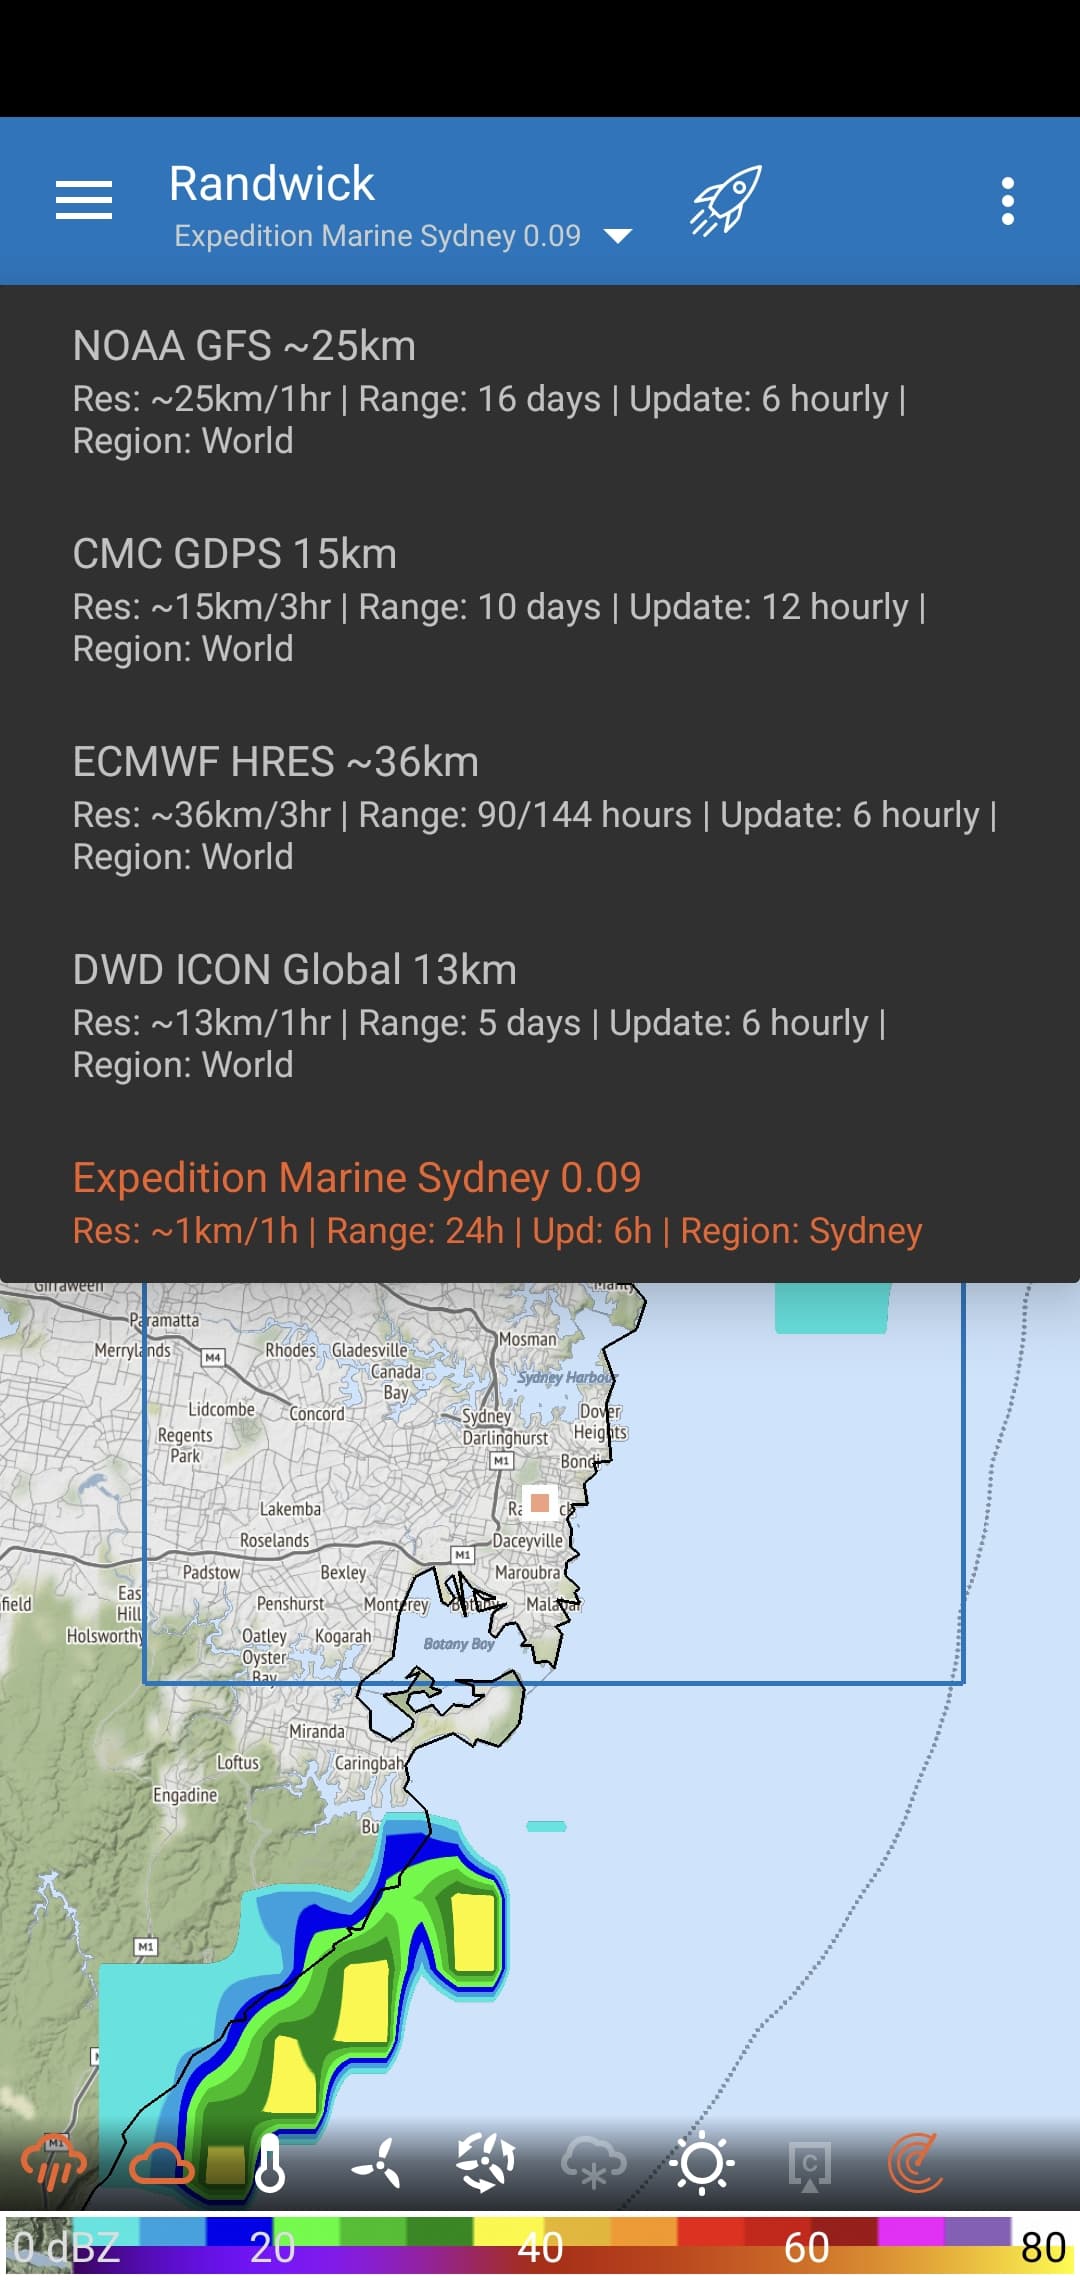
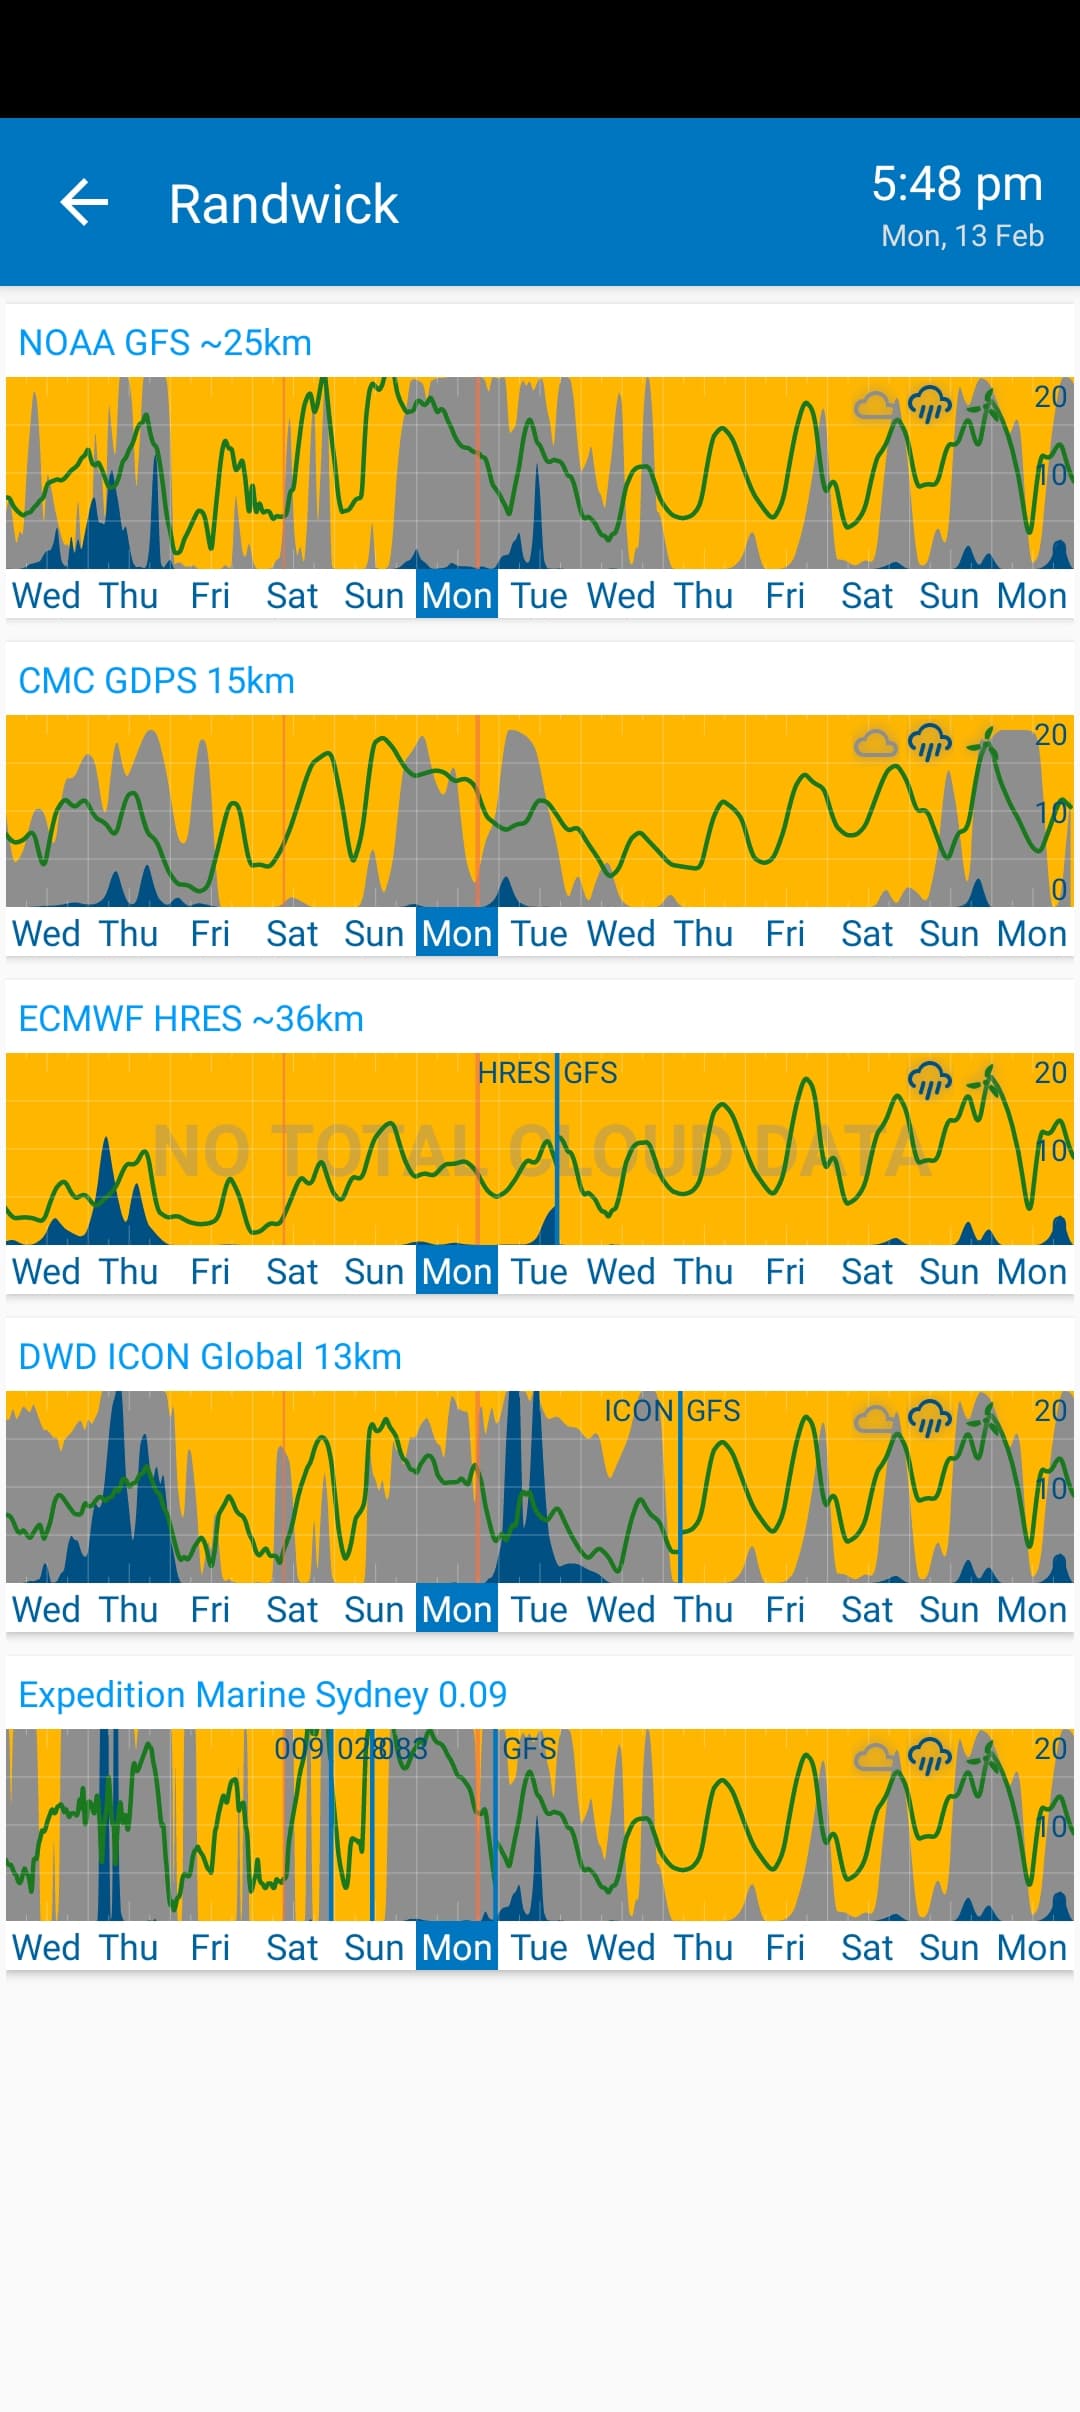
I very much doubt the silver package is superior to the Expedition Marine models. Here are some comparisons between GFS and Expedition Marine.

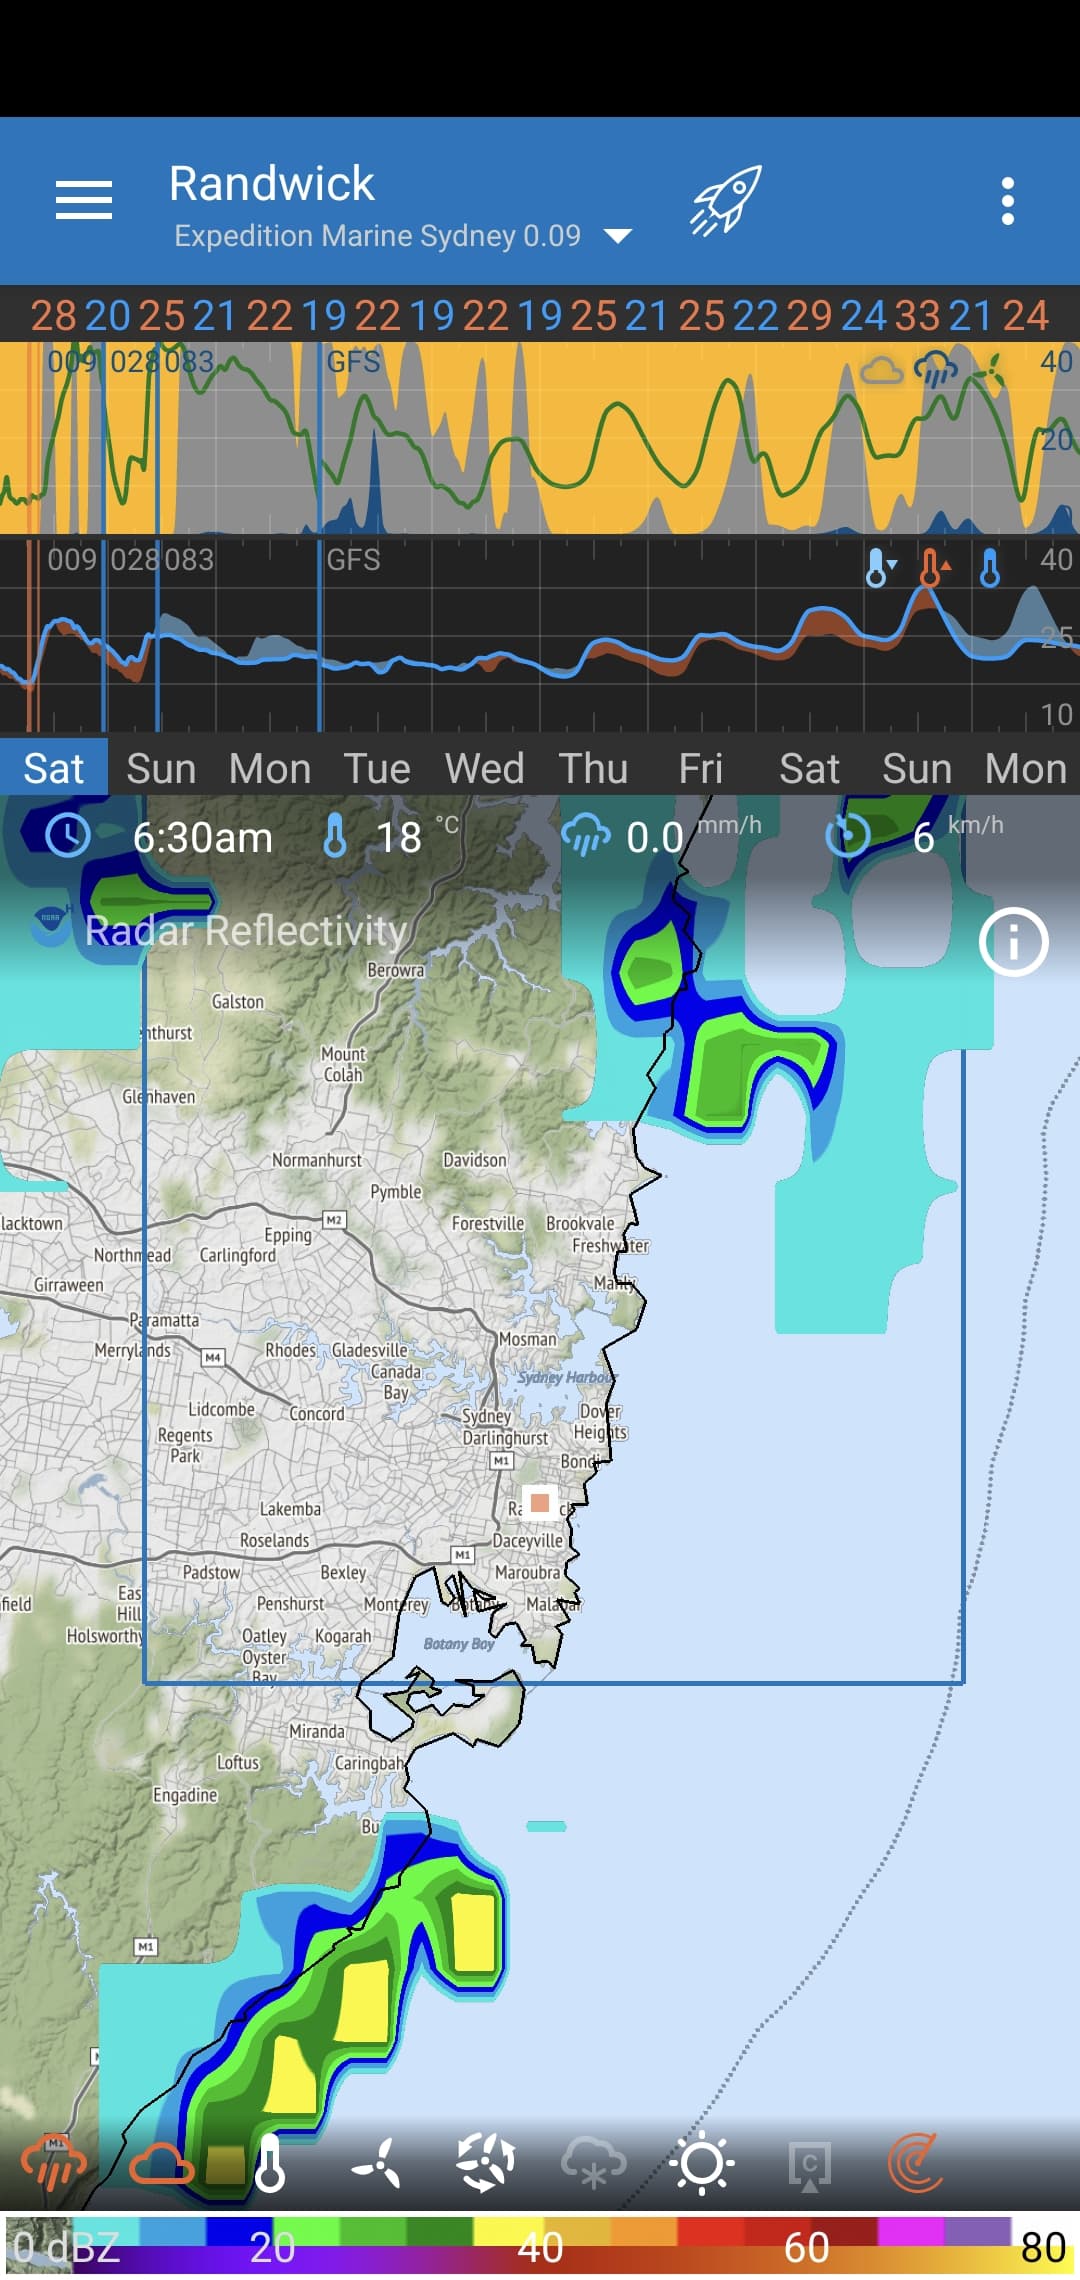
Notice the temperature differences between regions being resolved.

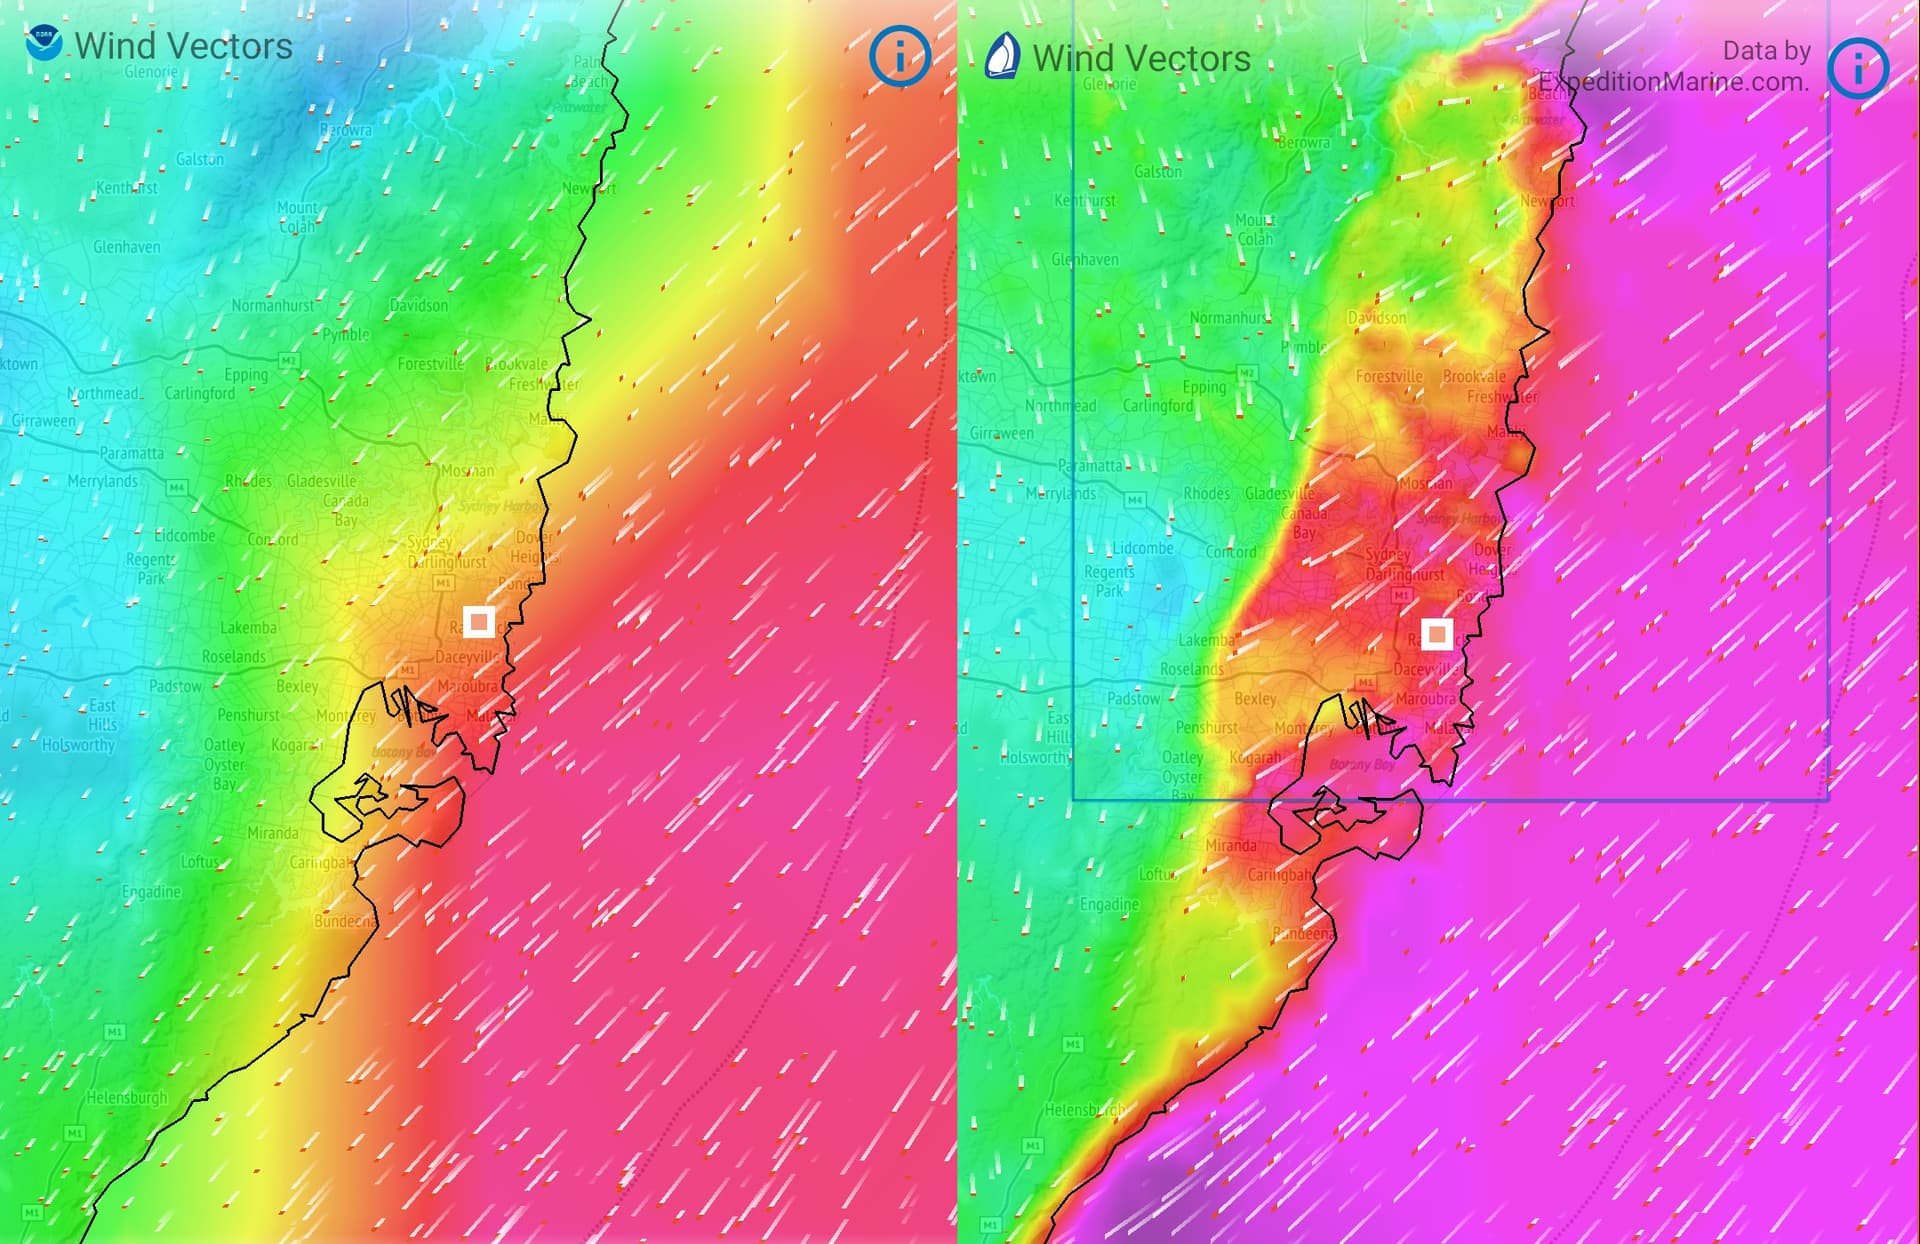
Notice the resolution where the wind form the west hits the wind from the east.

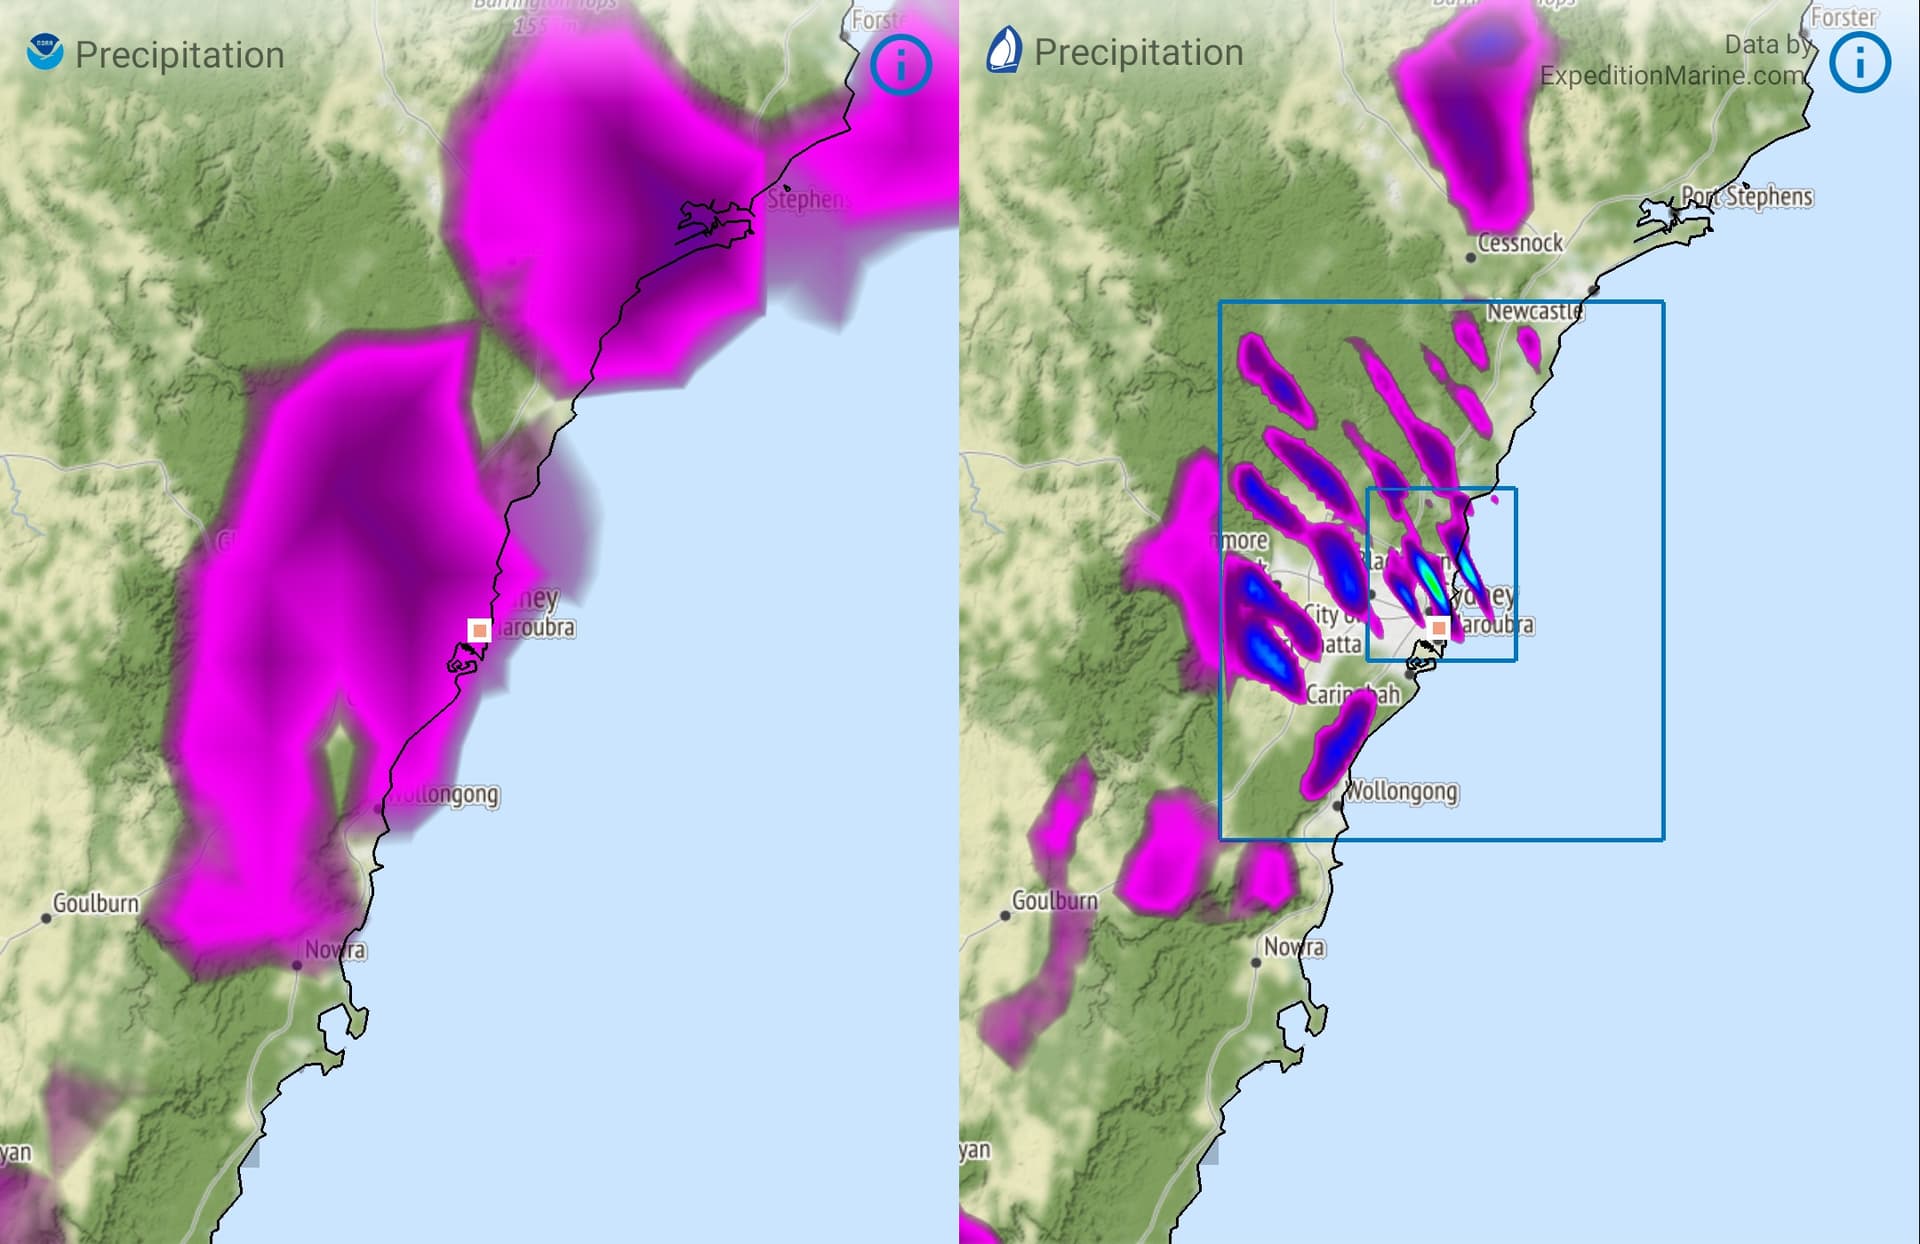
Here is a zoomed in view of precipitation. GFS is a blurred version of the Exp. Marine.

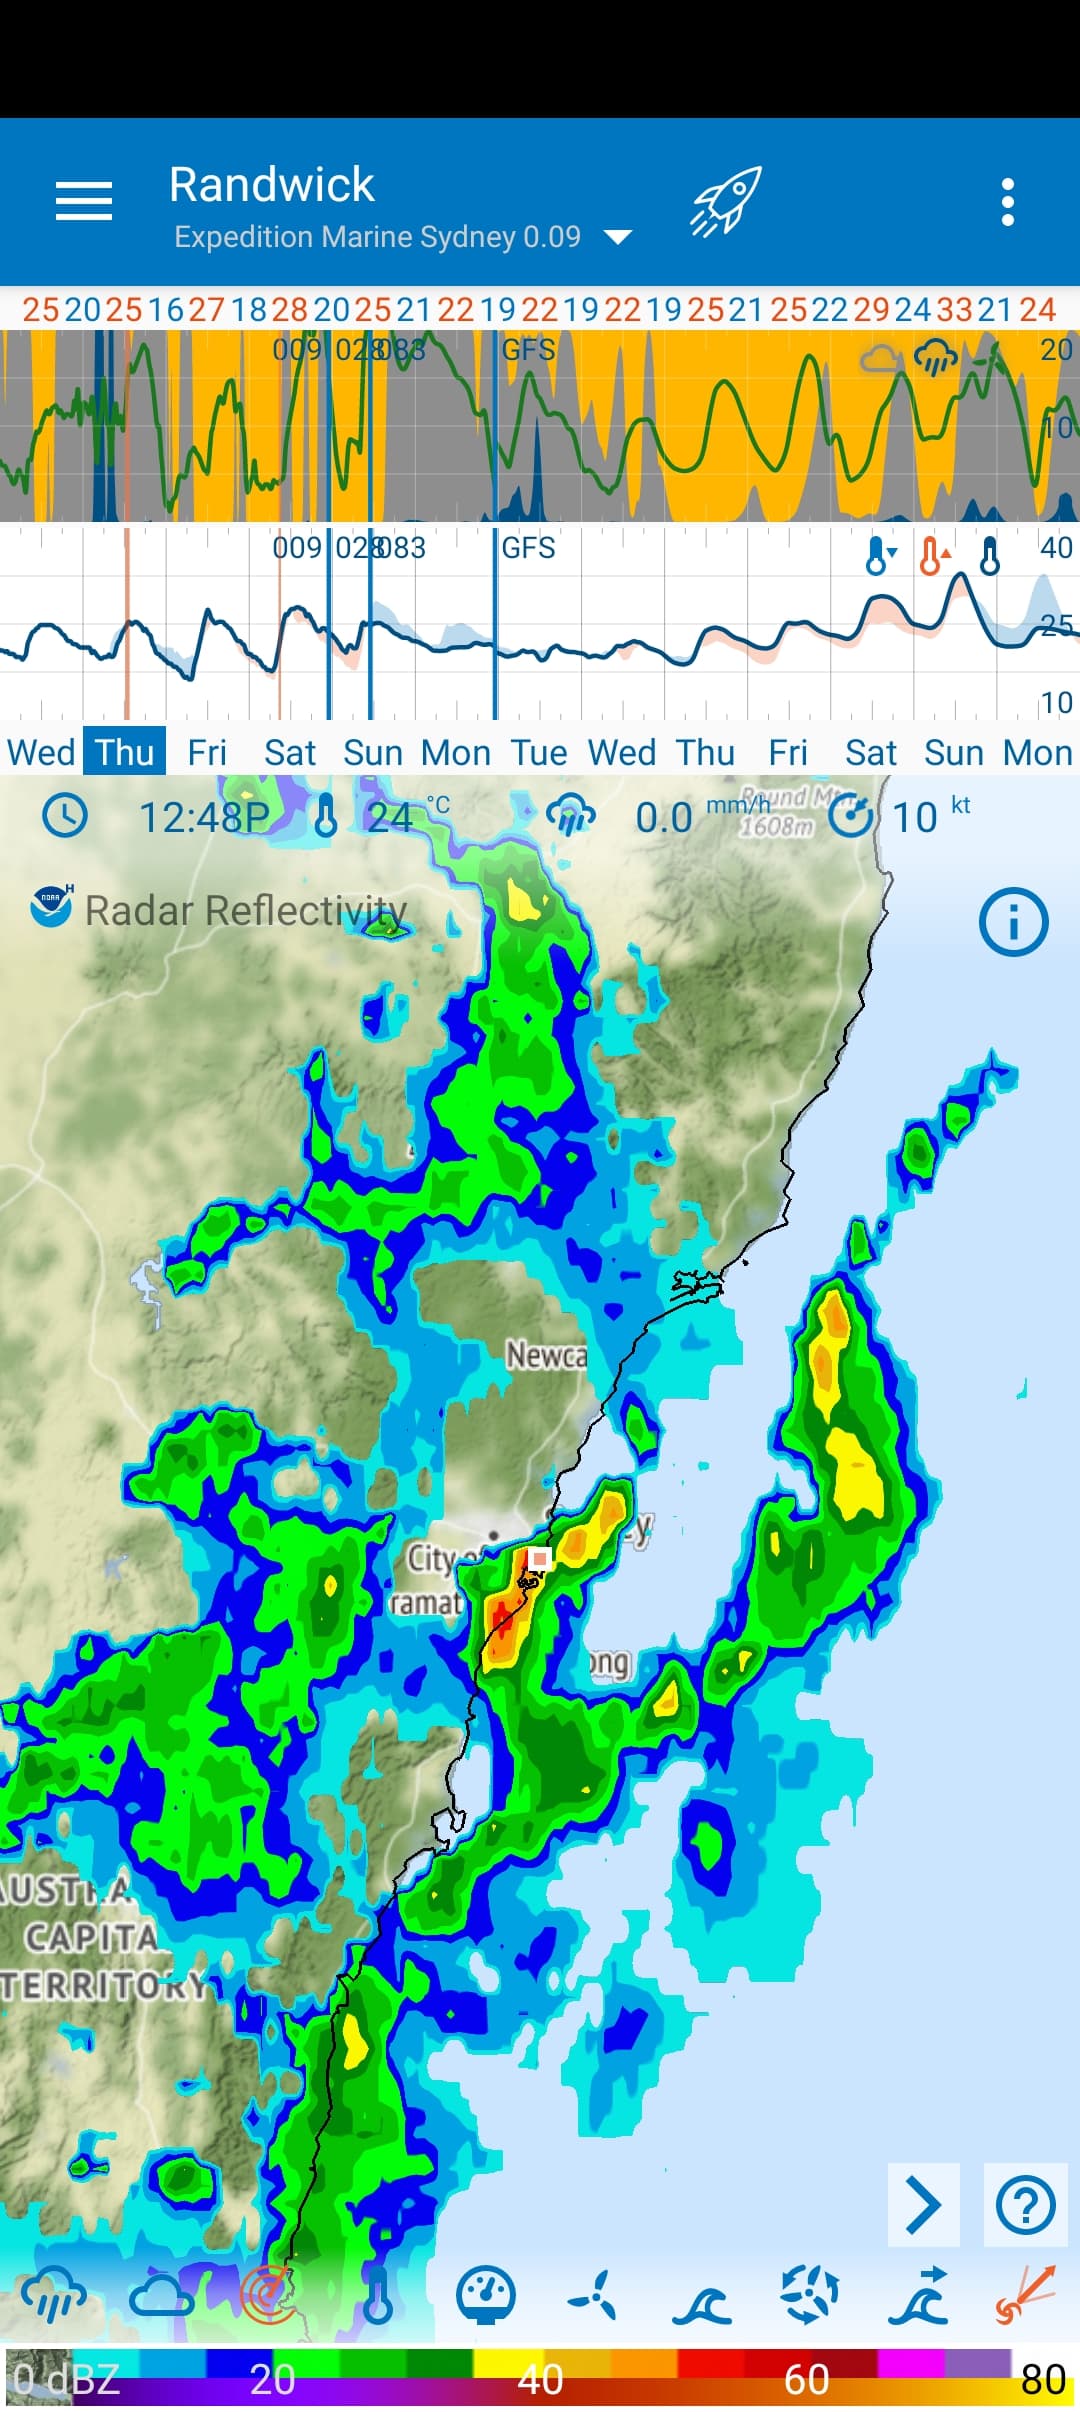
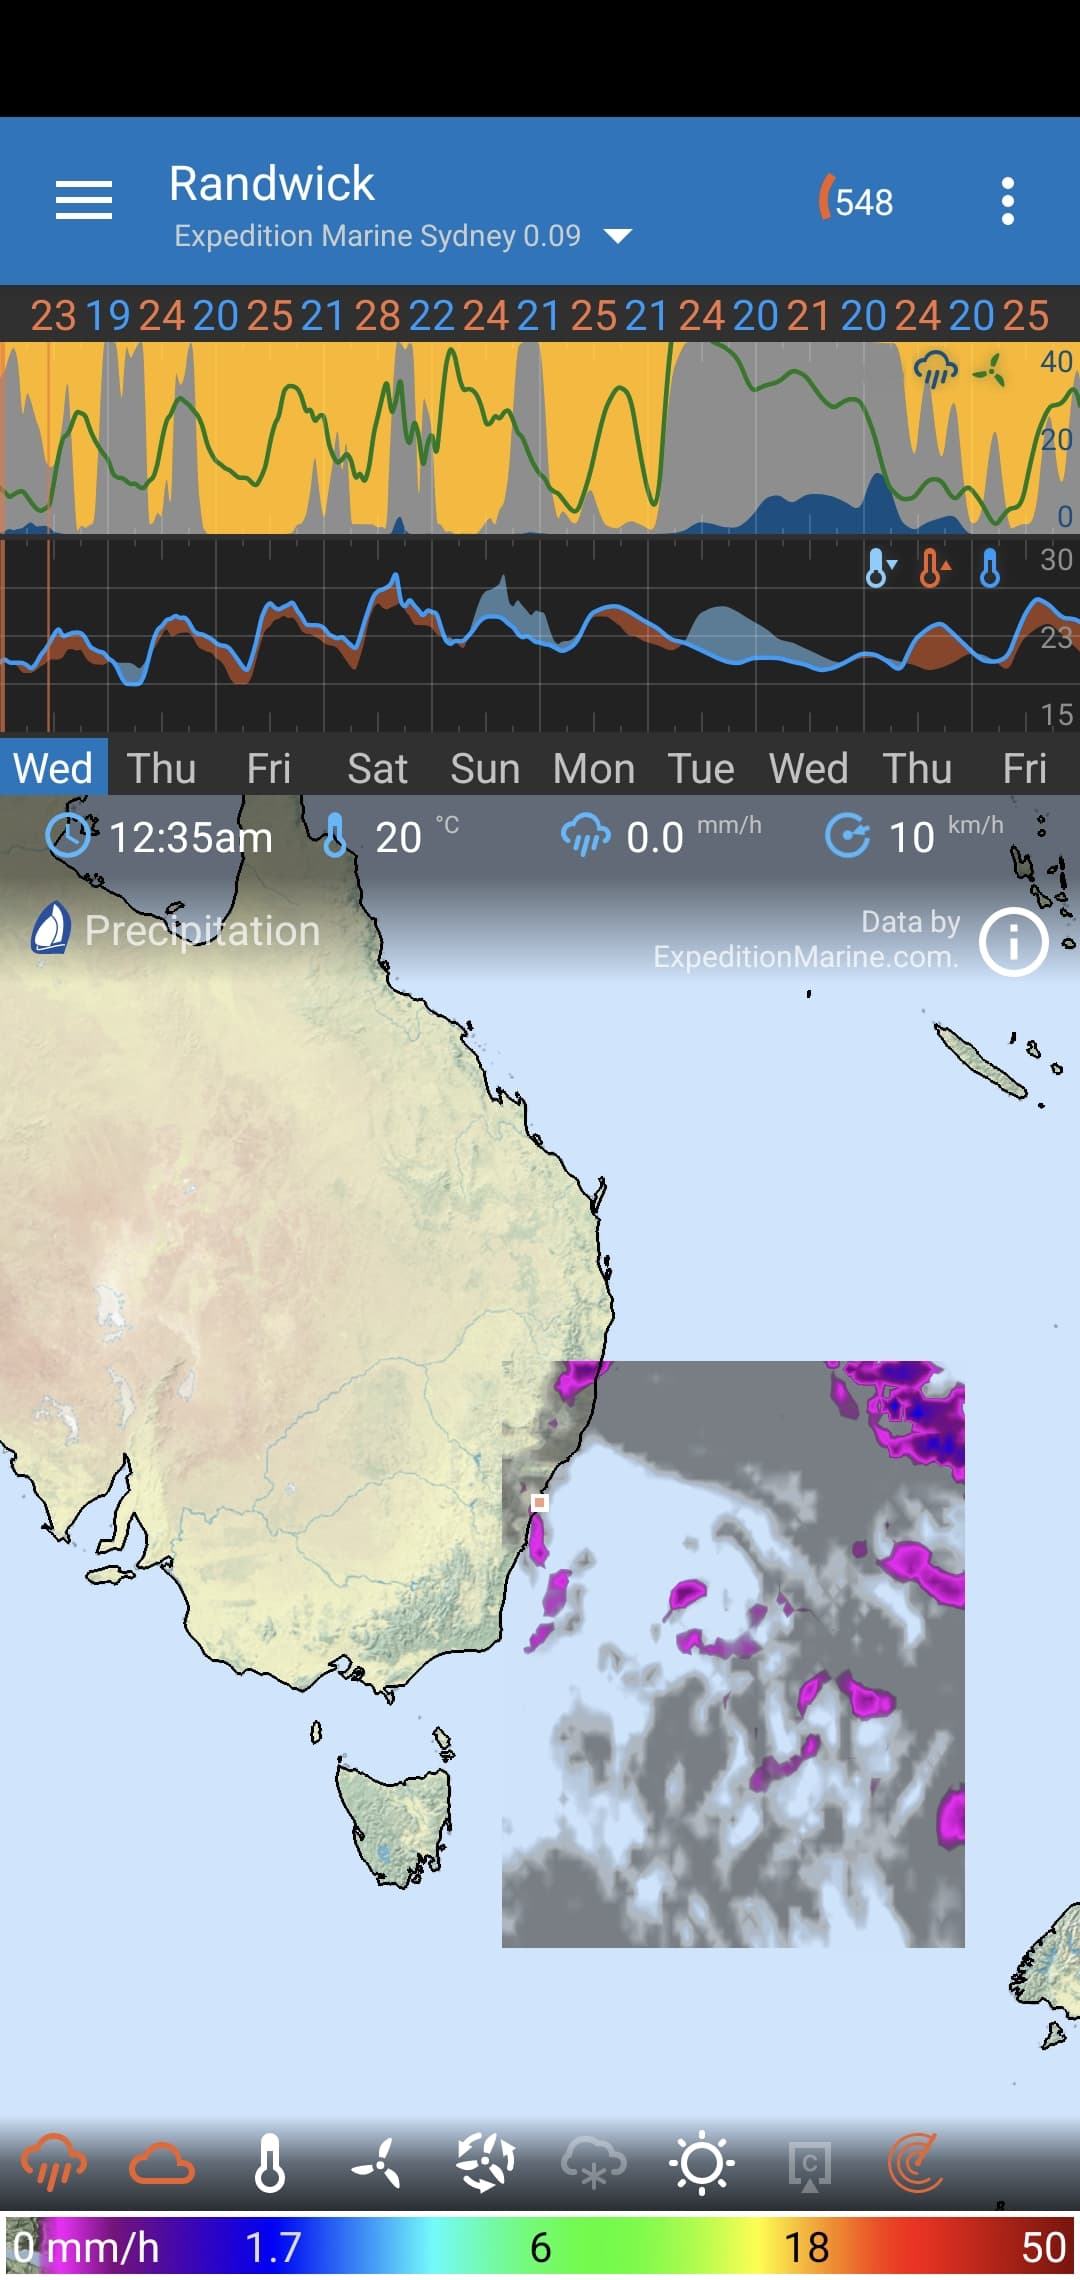
Here is a zoomed out version:

The common reasons people think models are inaccurate is they don’t understand the limitations of weather models and their expectations don’t match the reality.

Let’s take the temperature map for example. At 25km resolution, the GFS model has ~6 grid points in the view. Exp. Marine at 900m resolution will have 30 odd grid points between two GFS grid points. You cna see the temperature variation in the image - how does GFS capture this temperature variation? It simply can’t represent 30 temperature values with one value so it takes the average. So when people say GFS is consistently 5C wrong, this is the bias caused by taking the average. This is the most common limitation people don’t understand. Interesting tip, this bias can be consistent so you can remove it to get a more accurate prediction of temperature, and is what your standard weather app like Accuweather does - but you lose the big picture. This is a simplistic approach to Model Output Statistics (MOS).

The other example is the precipitation. You can Exp. Marine is more defined and GFS is blurred out. So people think GFS was more accurate because it showed rain when there was rain whereas the more defined Exp. Marine might not pass over them and does not show rain. But here’s the thing, the Exp Marine pattern of rain is generally a good prediction of what the rain will be like but the exact location where the rain blobs will be is more difficult to predict. In the example above, I would say there will be passing rain showers.

Why is it difficult to predict were the rain blobs will be? It’s because weather models take 4-5 hours to solve, so you’re at best looking at a weather prediction based on data measured 6 hours ago. At worst, it can be based on data measured 9-10 hours ago. A lot can change in the weather in a few hours. By this stage, the original prediction might have predicted the rain to arrive an hour too early or late - then people think the model was wrong. Whereas the blurred out prediction by GFS is so wide that arriving a hour early or late, doesn’t matter, you are still covered by the blur. This is another limitation of weather models people don’t understand.

One of the best models in the world is HRRR, where they reduce this limitation by solving a 3km resolution model over the entire USA every hour!! and has 15 minute time steps.

They also resolve the model 20 odd times using slightly different starting conditions. These are called Ensemble models. This would result in different rain patterns. You can see a good example of these predictions if you turn on hurricane tracks. These show the path predicted by each of those 20 odd models. There’s Cyclone Gabriel hitting Auckland at the moment if you want to see this.

Low resolution global models are good for predicting large weather system and indicate when rain might occur.

High resolution model capture the variation caused by fine terrain features and predict the patterns of the rain.

People complain that the weather models shown in Flowx are inaccurate. They fail to realise billions are spent to solve those models and are the best weather predictions human have ever made. But they still have limitations.

Fun fact, the weather predictions you see in typical weather apps (Accweather, Wunderground, Yahoo weather, …) all use these weather model (GFS, ICON, GDPS, ECMWF, HRRR, RDPS, etc…) to make their predictions.

3 Likes

BTW, you can easily downgrade/upgrade via the pro store in the app.

2 Likes

Hi Duane

Thanks for the detailed explanation of what the limitations are and what I should expect. Going forward I will use your advice and use a more over encompassing strategy

Cheers

2 Likes

I tried to zoom out and check out Auckland cyclone but I’m limited to a box on all weather models that looks like this

What am I doing wrong??

2 Likes

2 Likes

I didn’t know that. Very helpful. Thanks!

2 Likes

Ah it seems to be working now.

One last question. I k own the pro version is updated every 6 hours… bur what times of the day is this?

2 Likes

The “548” number at the top is the number of tiles queued up for download. If you zoom in/out, it grabs the most appropriate tiles. If you change places, it’ll queue tiles for that place. If you click on all the data types, it’ll queue them for download. If you change data sources, it’ll queue more tiles.

I think you’re on a slow internet so you need to be a little patient. I do a lot of development and I rarely get over “300” downloads queued.

3 Likes

Click on the at the top-right of the map or “Info” in the top right menu.

I highly recommend browsing through the help section.

3 Likes

I highly recommend browsing through the help section :slight_smile:

3 Likes

Hi @Lockscombi and welcome to the forum!

I’m glad that @duane could give you got the answers you were asking for.

Another possible reson for the model or measurement not matching with reality is somone doing this:
xkcd: Weather Station

Have a great day! =D
Cheers!