Independently of the models I use most of the models that I like has hourly rain mm/h.
will be nice to be able to also show rainfall accumulation between two datetime.
Regards
Independently of the models I use most of the models that I like has hourly rain mm/h.
will be nice to be able to also show rainfall accumulation between two datetime.
Regards
Hi,
Rain accumulation is a common request. In fact, many data sources release data as accumulated precipitations which I then de-accumulate. The reason is that the accumulation start time doesn’t line up with everyone’s start of the day in different timezones.
I do plan to add accumulated data, but I want to add submenus first. Submenu is a row of icons that appears above the row at the bottom of the map so when, for example, you click on precipitations, it’ll show you more options related to precipitation, one being accumulations or instant precipitation.
The accumulation between two datetimes is a bit more complex but I think we can come up with something.
One thing I’m wondering is whether a rolling accumulation is useful. For example, a 3-day rolling accumulation, will accumulate the rainfall for the past 72-hours from the current time on the slider.
Cheers, Duane.
Cheers, Duane.
Thanks Duane, a first and good approach could be +24 +48 +72 h 24 hour accum from 00z each day ?
I see this kind of products in NOAA maps.
How about a scrollable timescale. I would cherish that functionality; to go back 72hrs or whatever. I see Flowx adding the hourly accumulation as a graph line. Now big wishes here: give us another widget with accumulation numbers. Concise, relevant, no digging for info. Wow! Maybe it can do a count down in days/hours until the next rain event as well. Ok off topic. Implement rainfall accumulation in some fashion, please. It’s the one thing I don’t use Flowx for.
Well actually 1 of 2 things I don’t use Flowx for. The other is for model comparison via very simple temps and icons. Some days, and times of day, I just can’t be burdened with the data complexity of Flowx; then, a 10 Google forecast meets my needs. Interestingly, Flowx is always more accurate and provides the info I need to make my own predictions. Thanks Flowx!
Hi @FlowxLloyd, Welcome to the forum.
Do you mean a rolling accumulation graph? For example, if it’s a 24hr rolling accumulation, the graph value at 1pm Mon is the accumulated rain since 1pm Sun, vale at 2pm Mon is the accumulated rains since 2pm Sun, and so on. This is what I’m planning on implementing.
Regarding the comparisons, I was just this week thinking about adding a long-press menu option on the graphs called “Compare” and this will take you to a new screen (like the Graph Editor graph list) and show a graph for each data source.
I think this would be quite cool and useful. It will also mark the change from a single screen one-page app to a two-page app.
It’s nice to have you thinking about this. Thoughts:
KISS. Continue to value your single screen app. I once loved eWeather HD by Elecont software (atlas… to much info for at-a-glace daily use … Oh! But how I miss their 365 weather archive, that was interesting to gain insights into longer term weather tends… especially ocean temps. …I digress…) A long press to access a hidden screen and maybe a menu access for those that only tippity-tap and don’t read release notes, seems really cool. Though… that’s MORE access to date, not information. (DIKW) At some point the app needs to turn data into valuable information to be of practical value in decision making. So, in Flowx context, this would likely be best presented via deviations between models. How about expanding your current graphs to support overlays… via greyscale? dashed lines? or reusing your “cold/hot front” method… via greyscale? I would totally use the existing model selector drop-down in Flowx to enable an overlay - or even - the graph editor to play around with creating my own permanent ones, to learn if they have long-them value. Or heck, if the drop-down loaded the “Monkeys wedding” for each… that could do. Generally, I just dis-value full screen refreshes or transitions… Because every moment counts. Fewer steps, fewer delays = more value
Ooo. You push my mind. I certainly see how awesome it would be to have that as part of your text read out section. To scroll time and see that change hour-by-hour along with the current in/hr value (Could be awesome). 24hr is fine. Preferably, it should be a configurable setting. (I’ve stopped talking about graphs because the concept of future accumulation as a graph eludes me.) Exciting! But… it seems… the future should be forward “potential” accumulation, the past should be “actual” accumulation. Therefore, we need more than the current 4hrs of past data. Ha ha!! I push your mind right back.
Screenshots of accumulation data I value.
I don’t see the value here in future predicting future-past data. Flip-it to Mon 1p to Tues 1p. Keep it predicting future-future data (when it’s future data and flip to “what you said” only for past data) You made me make-up words to correct your future-bug. Riddle me this: if future-future makes sense, how would you likewise label future-future in the past? This still haunts me.
That would be perfect.
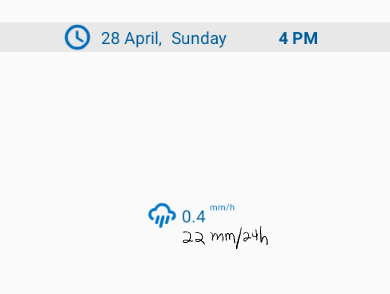
And a value like 24h accum. in the value, so keeping the swipe feature for hours, show a new value for 24h rainfall accum, and maybe a chart (this I dont have clear)
22mm from 4pm Apr 27 to 4pm April 28, and same for the rolling hours while swiping
You can have a 24h accum bar at 00 (or 07 as suggested above) of every day for example as reference.
sorry for the writing I made with my finger from my tablet.
Yeah, the current screen is pretty full. The current graph editor is a bit limiting. I want to add the ability to create new graphs and add any data in any way. It has been in progress.
I think I could get the Long-press a graph and “Compare” approach done pretty quick. One trick I try is to release only to pro users since they are usually long term users and understand Flowx a little more. This will get enough feedback for change or not.
Certainly, we can have a configurable accumulation period. I was planning to have 24h, 48h and 72h options.
I hadn’t thought about forward accumulation. maybe we should have -72h, -48h, -24h, +24h, +48h and +72h
Interesting. We are running out of space to fit numbers and graphs. There are plans to allow you to edit the numbers, i.e., remove temperature and add another type of data, e.g., 24h accum.
Personally I don’t use the numbers much. I only use them to validate the value of the graph or if the graph goes off the top - yes, I know about the wind range (it’s one of my oldest bugs).
Cheers, Duane.
Wow. Love it. Really appropriate KISS.
I’ve lost track of why going smaller than 24h is hard… but that is really what I believe is useful. -24, -12h, -3h, +3h, +12h, +24h, +48h, +72h, +168h? But again, remember Flowx doesn’t give more access than -4h in the graphs. How you would show past accumulation (very useful info, my favorite) is not clear. To me. But I want it.
This needs it’s own thread. It’s getting lost here. Data is a beast. You seem to be a beast tamer.
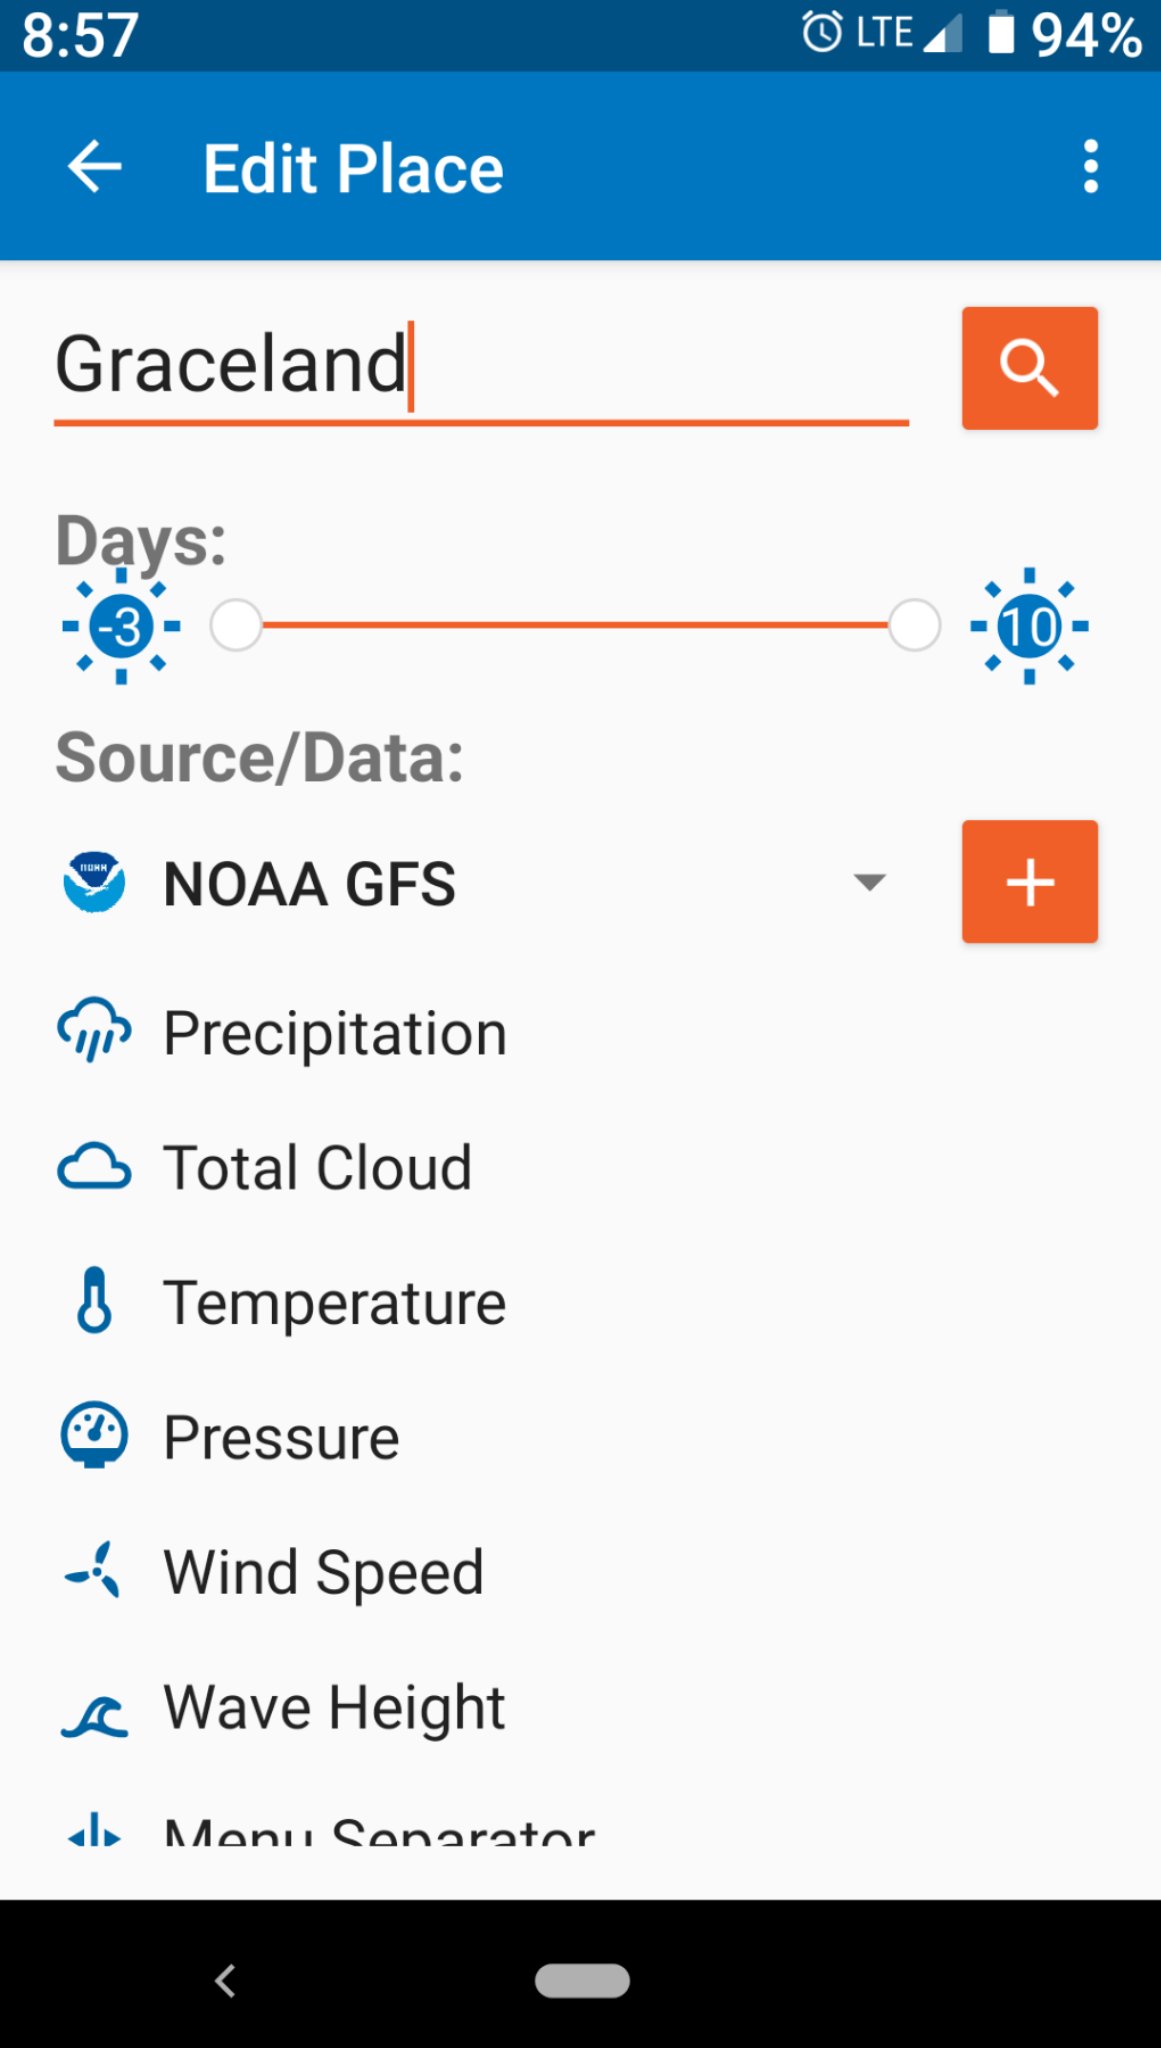
I have past data on the server and you can view up to 3 days in the past (hindcast). I think this is in the pro versions only. Just edit place and you can add the extra day into the past.
We can have a editable accumulation to set the number of hours.
@duane is my favorite!
@duane gave me more data!!
@duane let’s me customize the location name to a “space”!
@duane expands my vocabulary with funny words too!!!
All hail: @duane !
Funny words?? My vocab is all serious words 
Hello! I just found this old thread on the rainfall accumulation feature request. There are some great ideas here and it looks like the Compare option was implemented and works quite well. Are there still any plans to add the past/future rain accumulation option into any of the views? Or is this already available in some way through the settings or menus?
Best regards and thank you for the awesome app!
