Add the data age to the compare list
Could be a graph option in normal view.
2 Likes
Did you want the age since when the simulation was started, simulation finished, data released or data processed/available on Flowx?
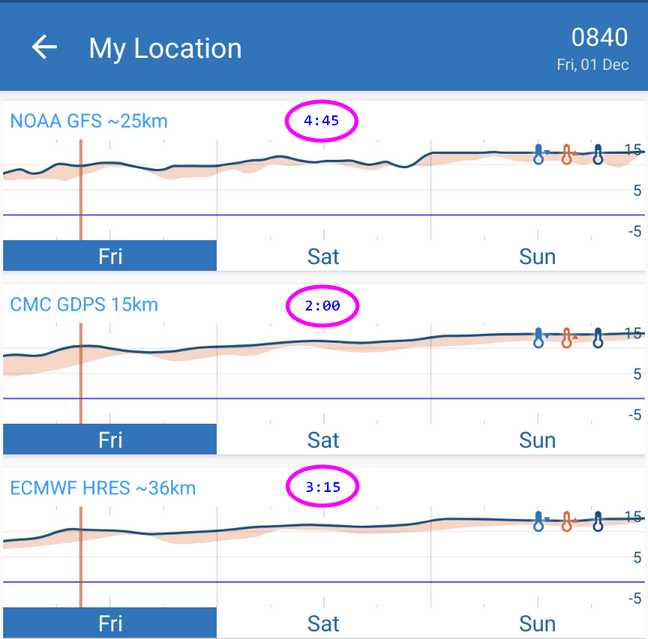
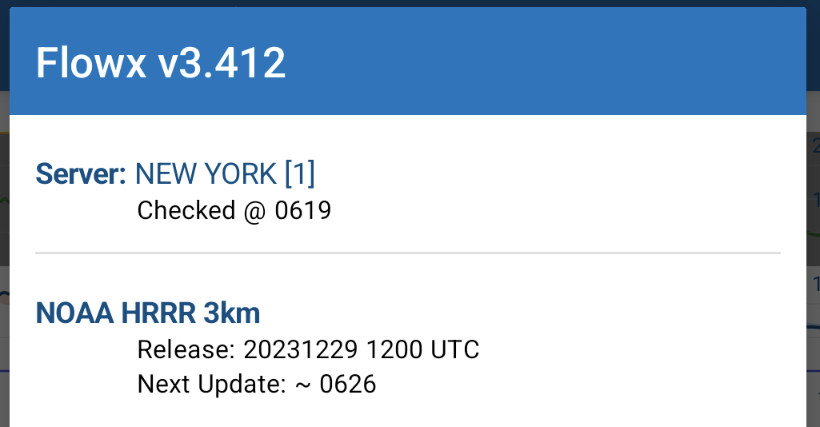
I do show the “Next update” time in the info box.
2 Likes
Hi!
For me it markes most sense to display the time since when the data was released by the organization that has produced it.
That makes me wounder:
- How long time does it usually take for you to process it and make it available on Flowx?, and
- is the “Next update” time in the info box the time of when the data was released or when the data is processed and available on Flowx?
1 Like
I’d rather know how old the data is. It’s trivial for the app to display the delta between current and release time.
- I’d hope Flowx builds an internal table of the update intervals and only queries servers appropriately
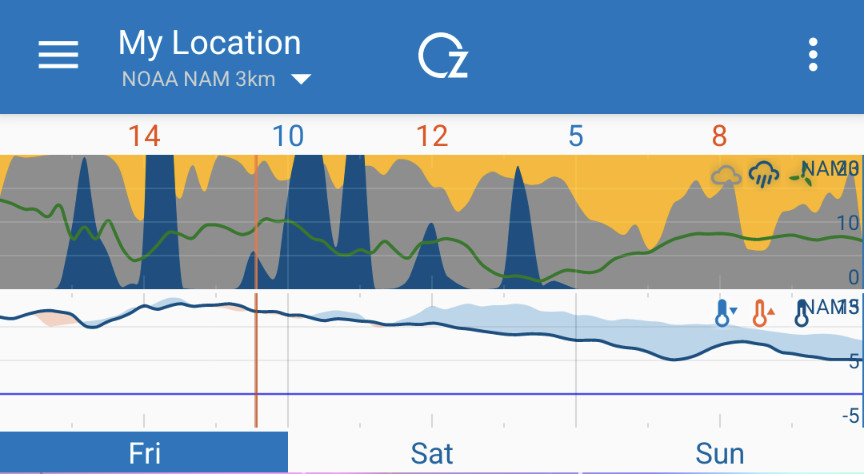
- The next update time is when Flowx will look. There seems to some confusion on Flowx part as NAM 3km is updated every 60 minutes and Flowx does 42???
Updates do not seem to coincide with data release for selected source. Or Flowx updates on it’s own time for other data?


IMO, it’s confusing to show server update in UTC and update in local time. Make them the same
1 Like
-
Once the GFS model is solved, it takes an hour and a half to release all data. It’s fast for me to process but it takes an hour an a half. HRRR releases every hour and it takes the servers a few minutes to process.
-
Next update is based on the time the data becomes available on Flowx.
2 Likes
Perhaps that explains the hour offset we so often see here between prediction and getting soaked?
1 Like
Flowx servers simply add the time between runs to the time it completed the processing of the data.
For example, GFS is solved four times a day, i.e., 6 hours between runs. The 20231223 0600 runs starts at 0600 hours UTC, it might take 4 hours to solve, then 1.5 hours to process data, which means, Flowx would process the data about 5.5 hours after the simulation started or at 1130 UTC. Now I add the 6 hours to the time I processed the data to get the approximate time (1730 UTC) for the next release.
2 Likes
The age of the data is NOT the “delta between the current and release time”.
The age of the data is the delta between the time the current time and time the simulation was started.
I can run the same GFS simulation on two computers. One computer take 1 hours to solve and the other takes 3 hours solve. This does not mean the second solution is better because it’s newer.
The reason the age of data is based on the time the simulation was started is because this is the time a snapshot of the weather conditions was entered into the simulation.
2 Likes
I don’t understand?? I’m getting confused by this discussion.
2 Likes
Why do you want the age of the data? This can help me understand what it is you really need.
The reason why I added the “Next Update” is because I wanted to know when to check back for new data.
For example, the time to the next update is valuable, because if you know there is an update in 20 minutes, you know to check back in 20 minutes to see the new data.
2 Likes
Not being a weather data processor, I had an incorrect assumption of the process.
I assumed the prediction data is current.
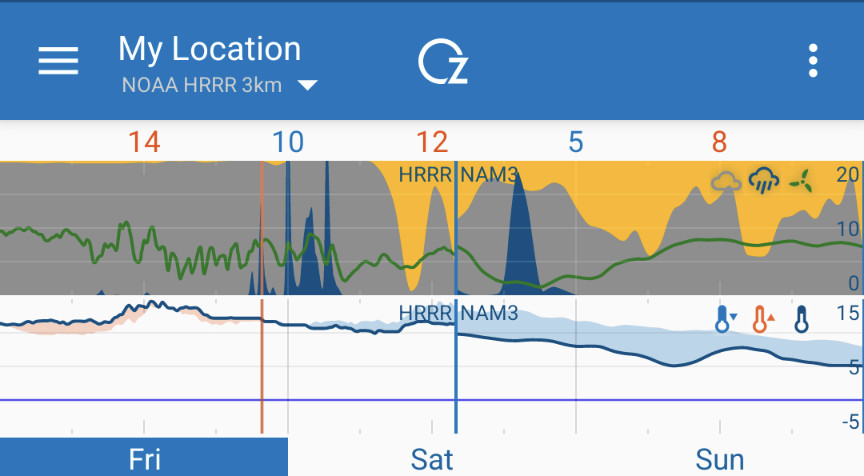
More often than not, as in almost never, do the predictions coincide with the current weather. Our weather changes rapidly here, making the HRRR superfluous other than a finer profile.
That being said, Flowx is our most used non-O/S app and top of the heap in UI.
Thanks, Duane
Keep up th GREAT work!!! ![]()
Perhaps a small primer on the Help web page to explain…
2 Likes
Peoples’ understanding of weather simulations and their limitations is the biggest issue I encounter through Flowx.
When a user emails or reviews saying something like “x is not accurate” - this is a tell-tail sign they don’t understand the weather predictions and their limitations.
To be honest, saying “Our weather changes rapidly here, making the HRRR superfluous other than a finer profile” is a tell-tail sign. HRRR is solved for the “Our weather changes rapidly” reason. HRRR is solved every hour and predicts 18 hours of weather. HRRR stands for “High Resolution, Rapid Refresh”. HRRR is one of the most advanced models in the world.
Being the most advanced doesn’t not mean it’ll get the exact weather prediction. This is the limitation of weather simulations many people don’t understand.
Weather scientists know the limitation of weather predictions and thus know when and where to apply them. When a prediction is made that doesn’t match reality, they know it’s within the limitations of weather modelling.
If you understand what “Ensemble weather simulations” are and why they are solved, you will go a long way to understanding the limitations of weather modelling.
I would love to educate users on weather modelling and their limitations but it’s a massive massive job and there is much content already on the web. Plus time spent on education content is time not spent on development and at the end of the day, I am building a weather app.
Here is a pretty cool chapter I refer to a lot. It’s worth a read:
https://www.eoas.ubc.ca/books/Practical_Meteorology/prmet102/Ch20-nwp-v102.pdf
You can skip the equations and detailed stuff, the high level stuff is a good start, especially chapters:
20.5 Forecast process
20.6.3 Ensemble models
20.6.4 Probabilistic forecasts
20.7 Forecast Quality and Verification
Read these and you’ll understand a lot about weather modelling and their limitations.
Note: this is one chapter is a great book on meteorology. Other chapters are worth reading too.
https://www.eoas.ubc.ca/books/Practical_Meteorology/
2 Likes
Hey, it just occurred to me. Anyone could read this book and make a small primer. Anyone keen? ![]()
2 Likes
Well Said @duane the key word is “Prediction” Hence Multiple Models They Compare the Models then they look at what has happened previous years do “Predict” What might happen. That’s why I get irritated when I hear “The Weather Person was Wrong”
the Above Says it All
1 Like
But what’s consistent is the time predicted is almost always off by ±one hour. The rain occurred @ 2020 and I walked the dog for half an hour @ 2130 w/o a drop.
Don’t get me wrong, as I love Flowx and it’s my most used app. But in the short term, at least here on the coast accuracy is close to zero.
1 Like
Refer to my long reply above. The answers as to why the predictions are consistently off is in there ![]()
2 Likes
I did read. Also slogging through the referenced document.
Probability says there should be an even distribution with some temporally spot on. Come to think of it. it is often correct: on rainless days ![]() We have about 180 per annum…
We have about 180 per annum…
Keep up the great work!
Happy New Year!!!
1 Like