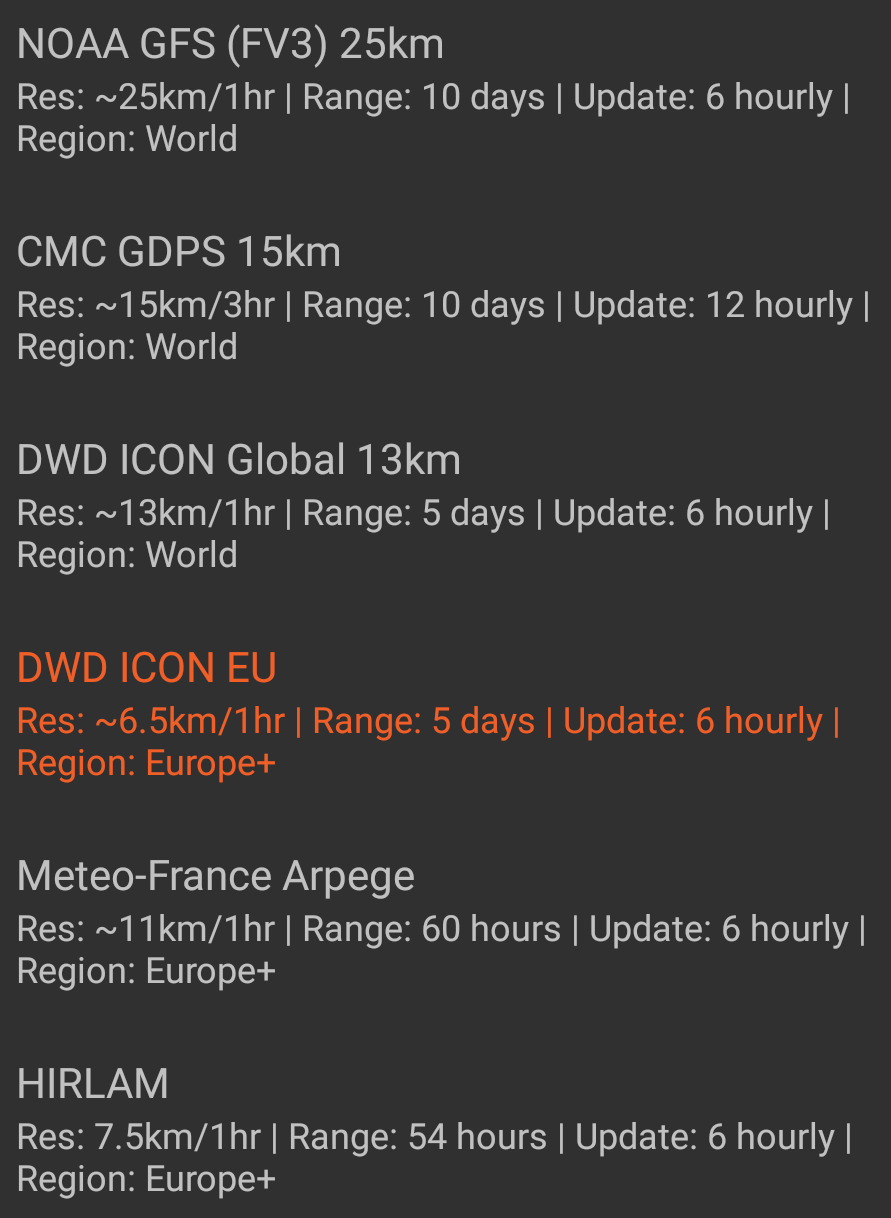
In graphs, and perhaps more in compare mode, it would be useful to, at a glance, be able to see something marking the
time of last and next expected update for the different available models.
Especially since sometimes a recently updated model might be more relevant than another that updated longer time ago, (and soon will be updated again).
This will add 4, possibly 6, extra lines (or markers) to the graphs in a very narrow window of 3 to 6 hours. It’s not going to look good unless you have only 2 or 3 days showing. I already find the transition lines obscuring.
Also it’s not clear to me how much value this will bring since the relevance of a model depends more on the resolution. So, for example, if you’re looking at HRRR, this overrides any other model because it’s 3km resolution, 15min/1 hour time frames, and updates every hour. Don’t really need lines for this.
For GFS vs GDPS vs ICON, the difference between forecasts is not as much as the difference in Physics and numerical methods used in each model. Or the differences caused by errors in measurements or estimates of the state of the weather. Just look at the difference in hurricane tracks that are caused by perturbing the estimated starting state of the weather.
I guess what I’m saying is that the release time of a model is not as significant as other things. It’s not something I would want people don’t understand this to falsely think newer is better.
I’ve thought about this all morning and I’m really not convinced this is worth spending time on. The last thing I want to do is add something that provides none or little value. But if many people really want this, we can try something.
This means that during a 6 hour cycle, there will be periods of hours at the time when some models are less than an hour old and others are up to 5 hours older. And it will vary which ones are the most recent ones.
So at least for me, there is a quite clear value to see this quickly, (without the need to read the latest version of the information in the two pictures above, and then to do some calculations in my head to figure out which model is most accurate for the hours to come.)
Yes, this should probably not be a, default, “one change fits all”-kind of thing.
I would suggest it as an option in the “Edit graph” setting.
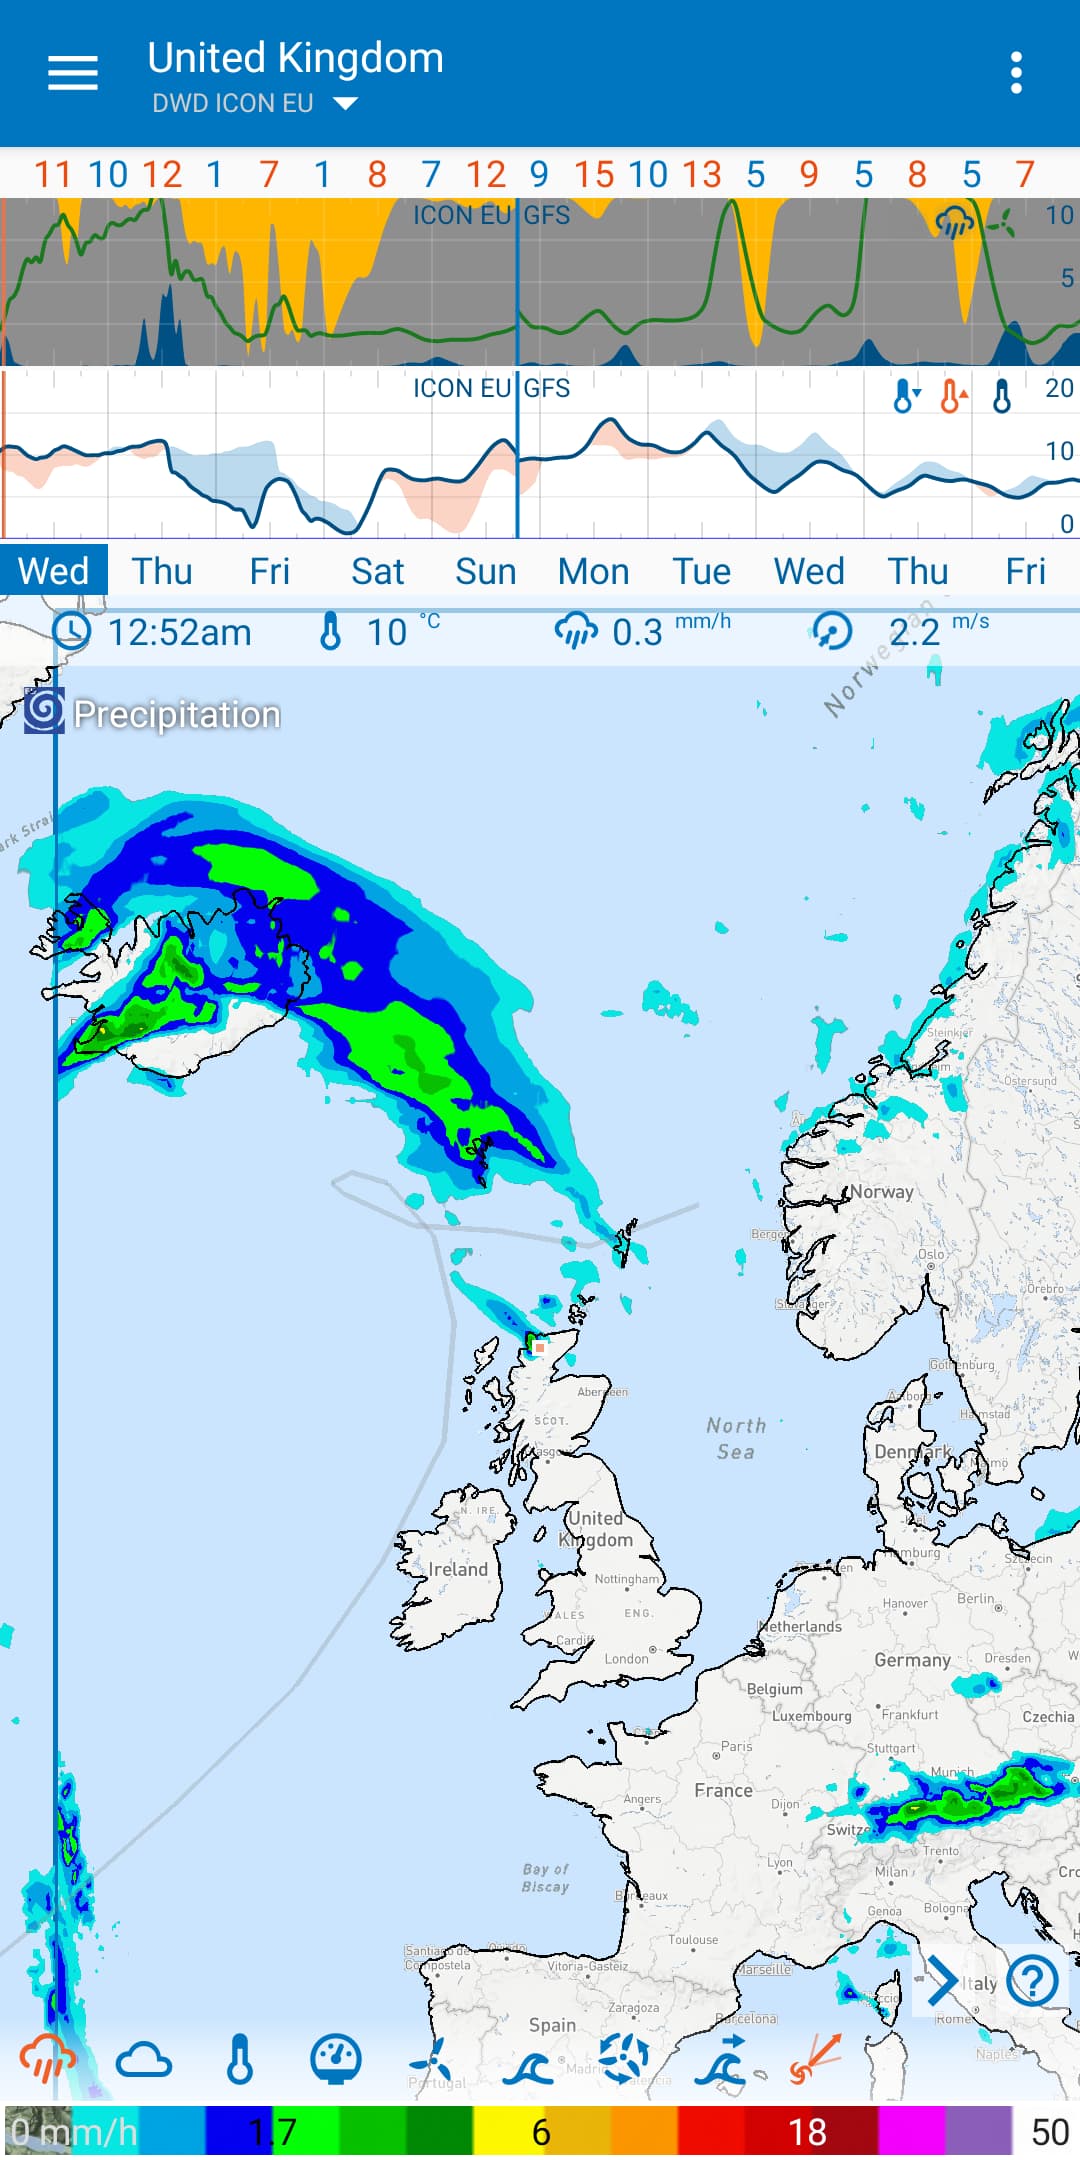
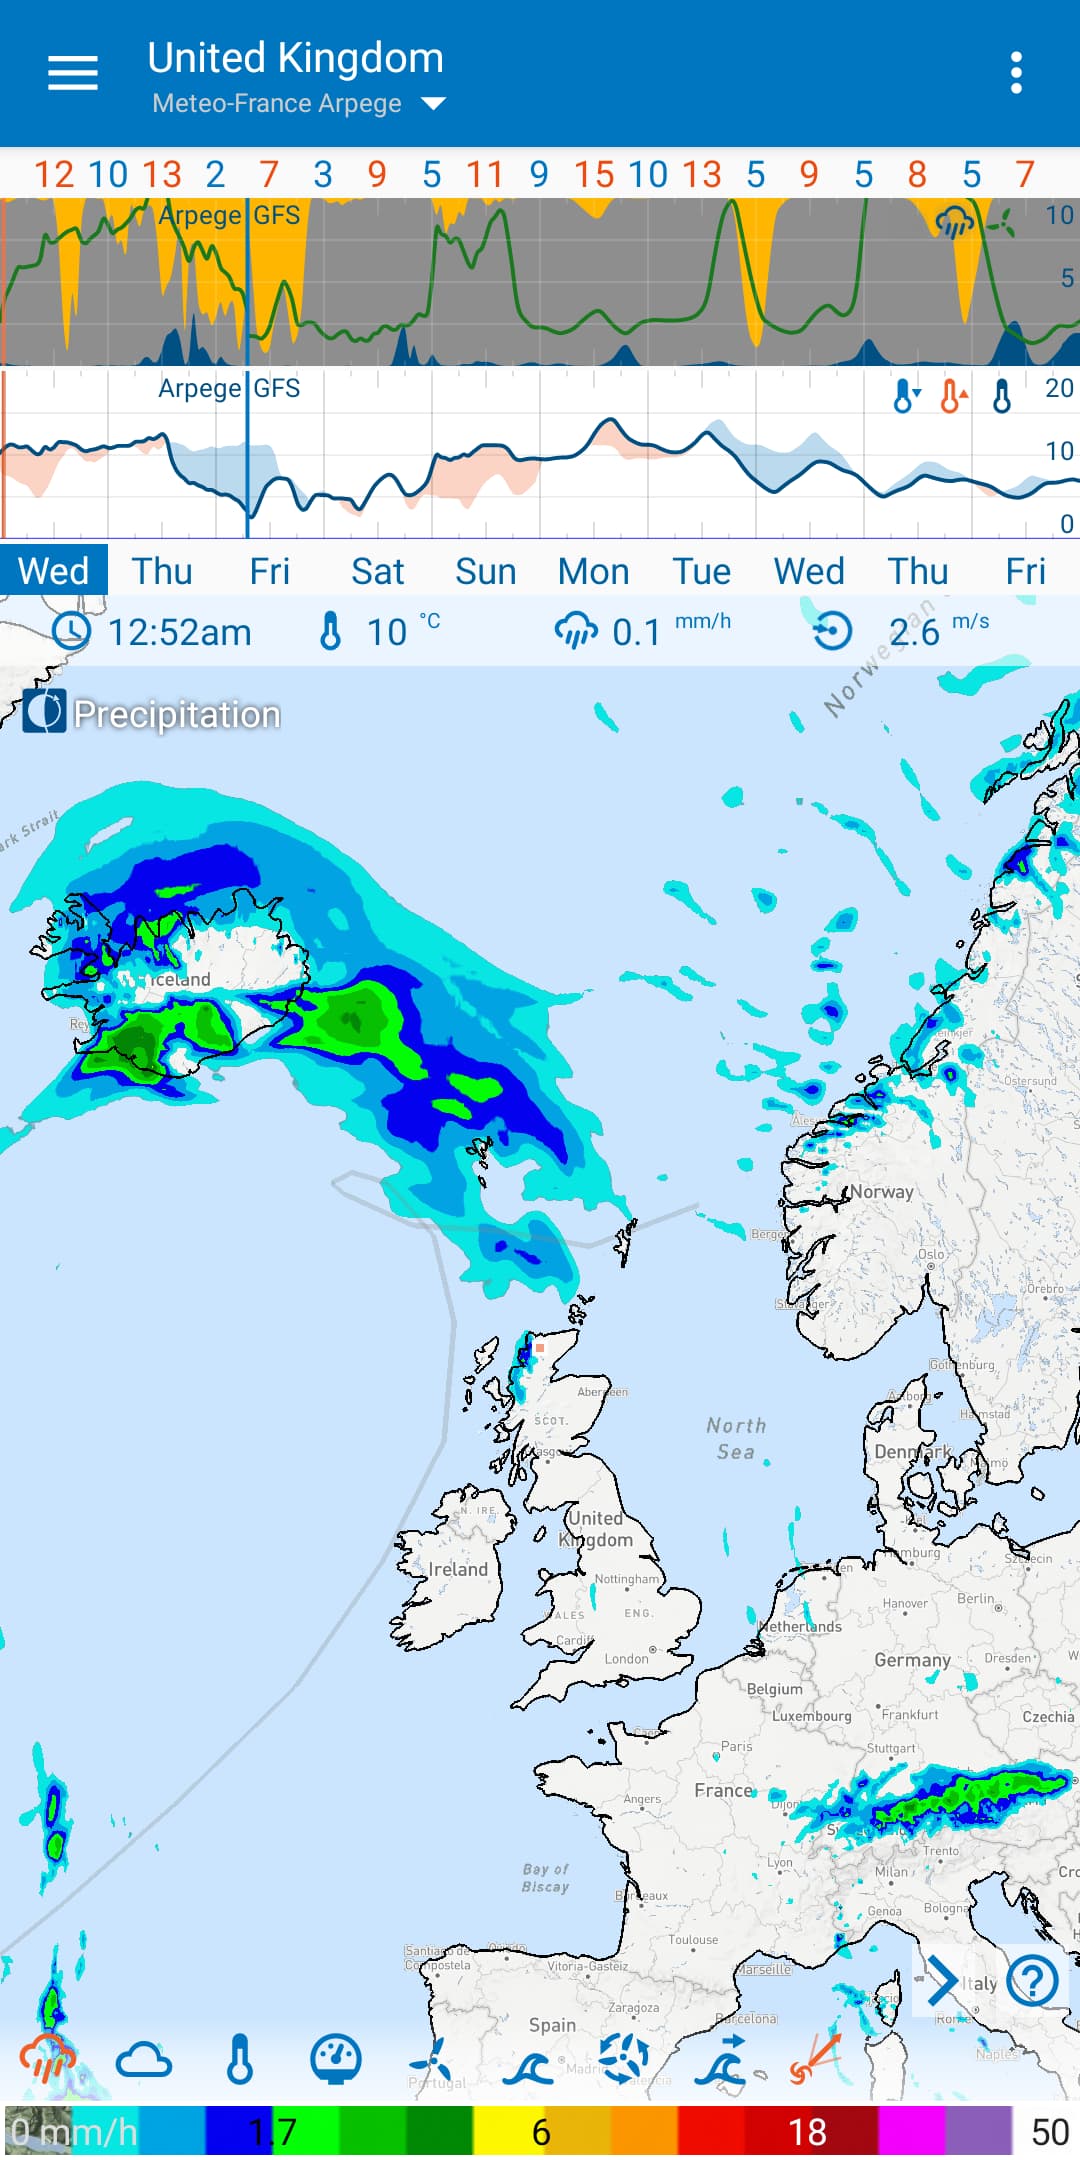
I totally agree. In the UK my choice of graphs are updated every 6 hours. Our weather is massively varied over a small area. When I Compare graphs there might be only one that shows rain in my area, which is because it is a recent update.
I need to know when the last update was and when the next will be. It should be possible on the same line in the compared graphs.
Eg.
Last update 13:00 Next 19:00
5 hours out of sync is a huge difference in the uk.
I can add update times to the graphs - it’s relatively easy but it’ll probably have to wait until I’ve done the rewrite.
I don’t think I’m explaining this very well. People should not focus on the newest model. The variability between models due to grid resolution, physics being modelled, numerical methods, starting conditions is most significant especially for low res model.
I have three low-res models in my region. I very rarely look at the update time. I look at all three models and look for the similarities between them.
My worry is a user will look for the newest model and blindly think it’s the best - this is very wrong.
Flowx shows the raw data from weather simulations. If you interpret these results incorrectly or don’t understand the limitations of the models, then you’ll be disappointed. It’s often the cause of 1-star reviews.
I don’t know what the highest resolution model is in your region but the low resolution models (e.g., ~10km) will not capture this variability very well. These models are designed to get the large scale weather correct. It is the high-resolution model, which are nested inside these low-res models, that capture the finer details of the terrain, etc… and predict the variability.
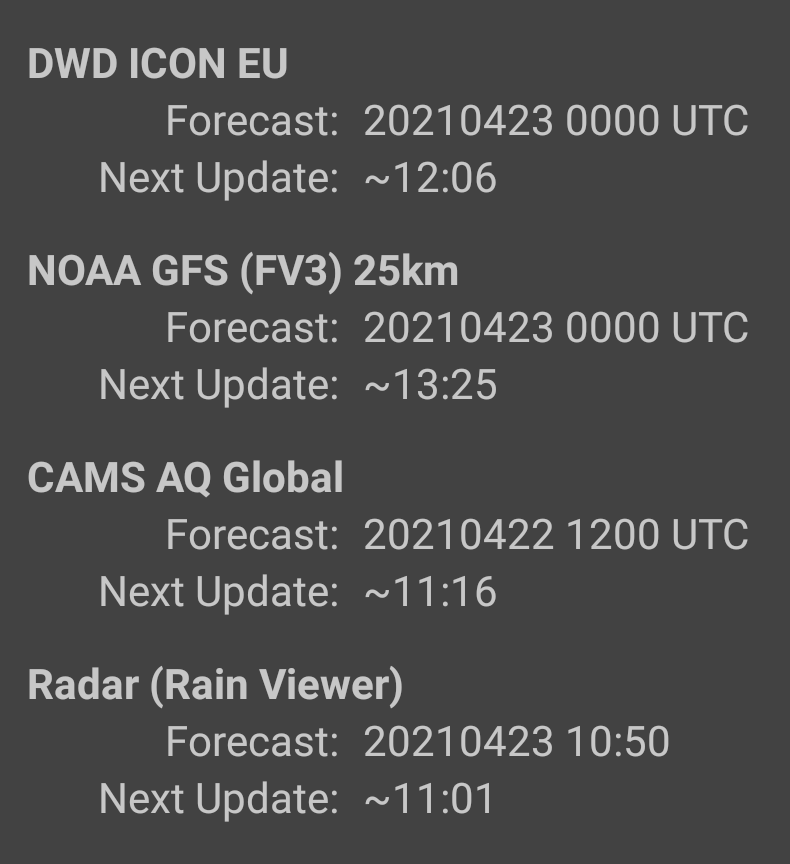
Thank you, if the time of release is the same time for all models, then there is nothing to be done.
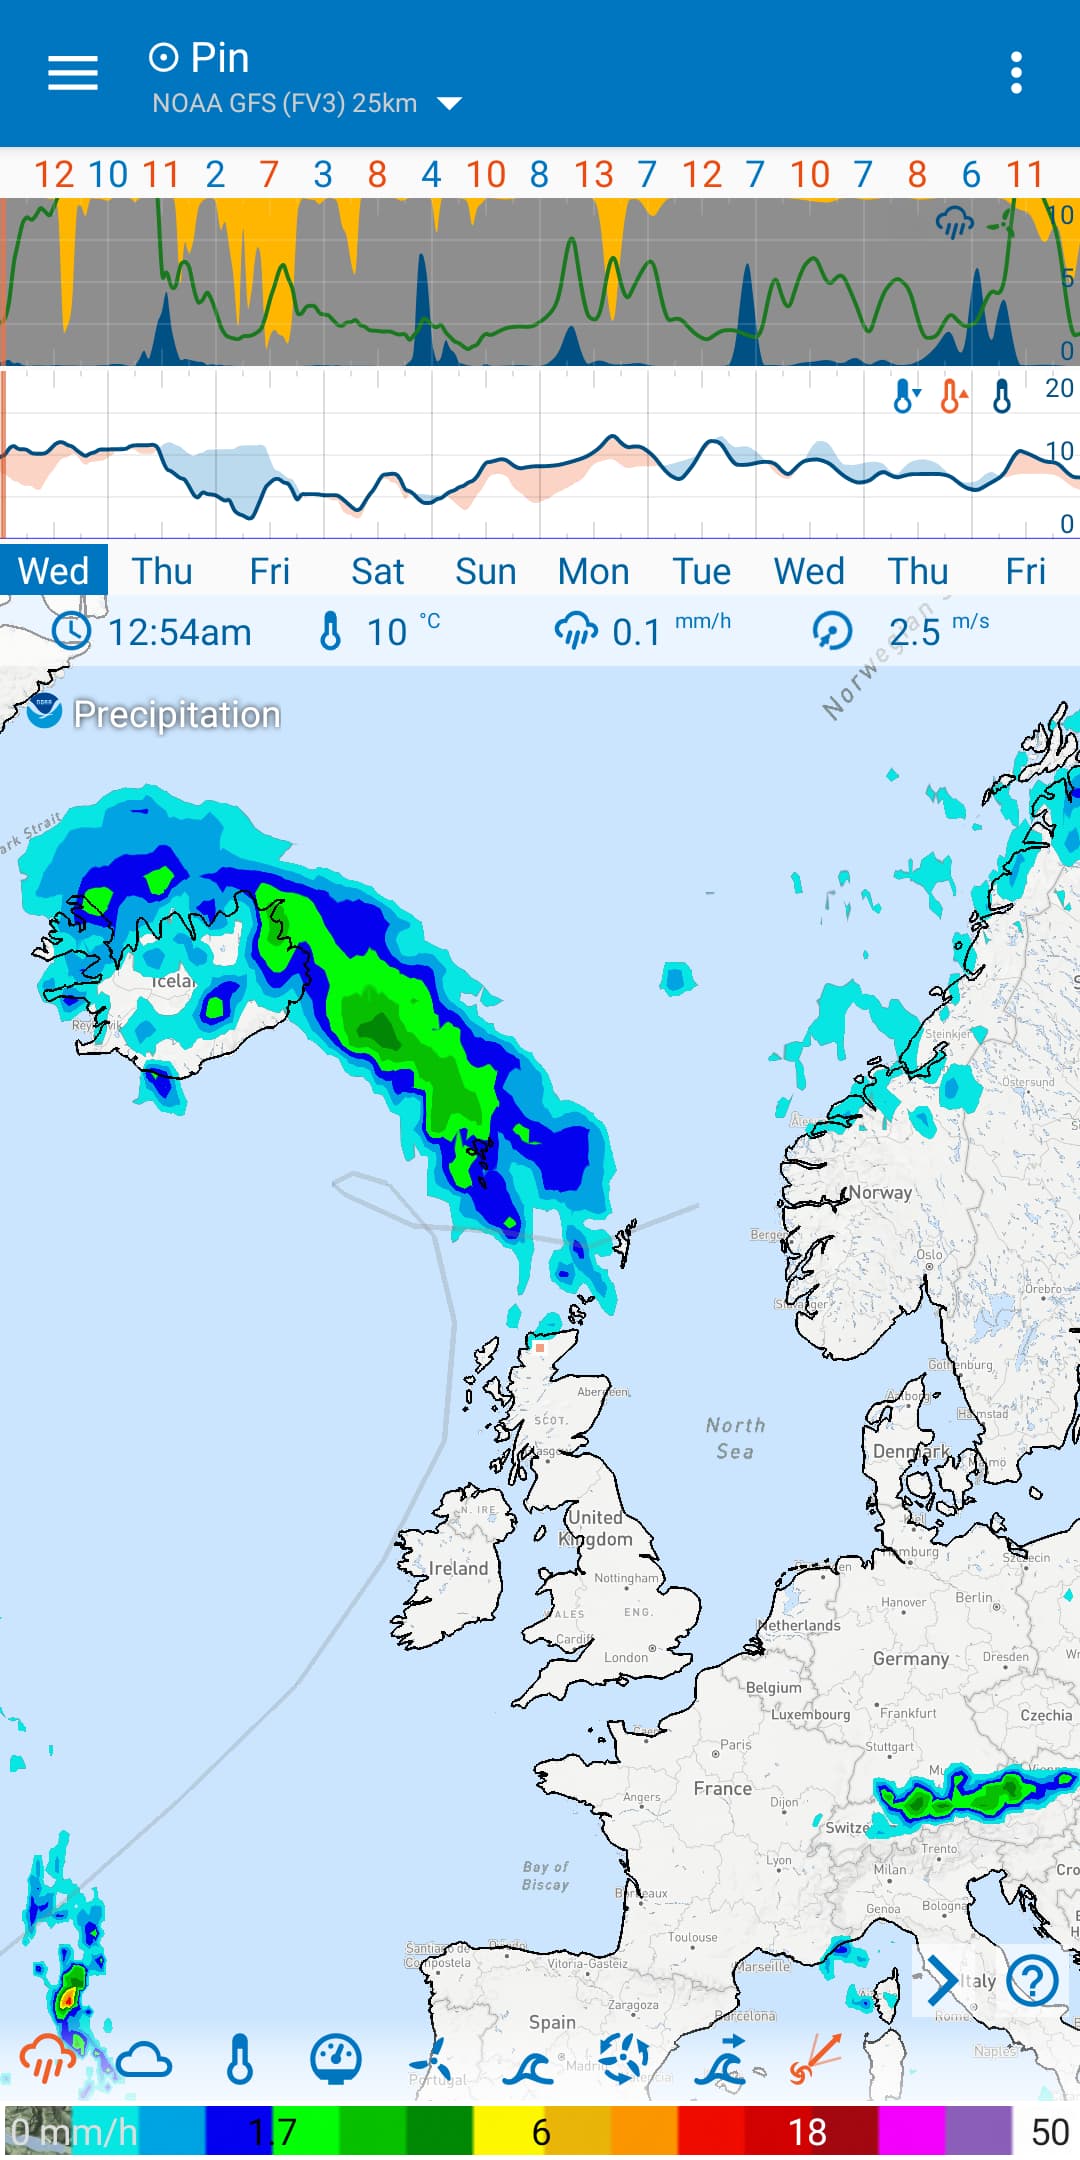
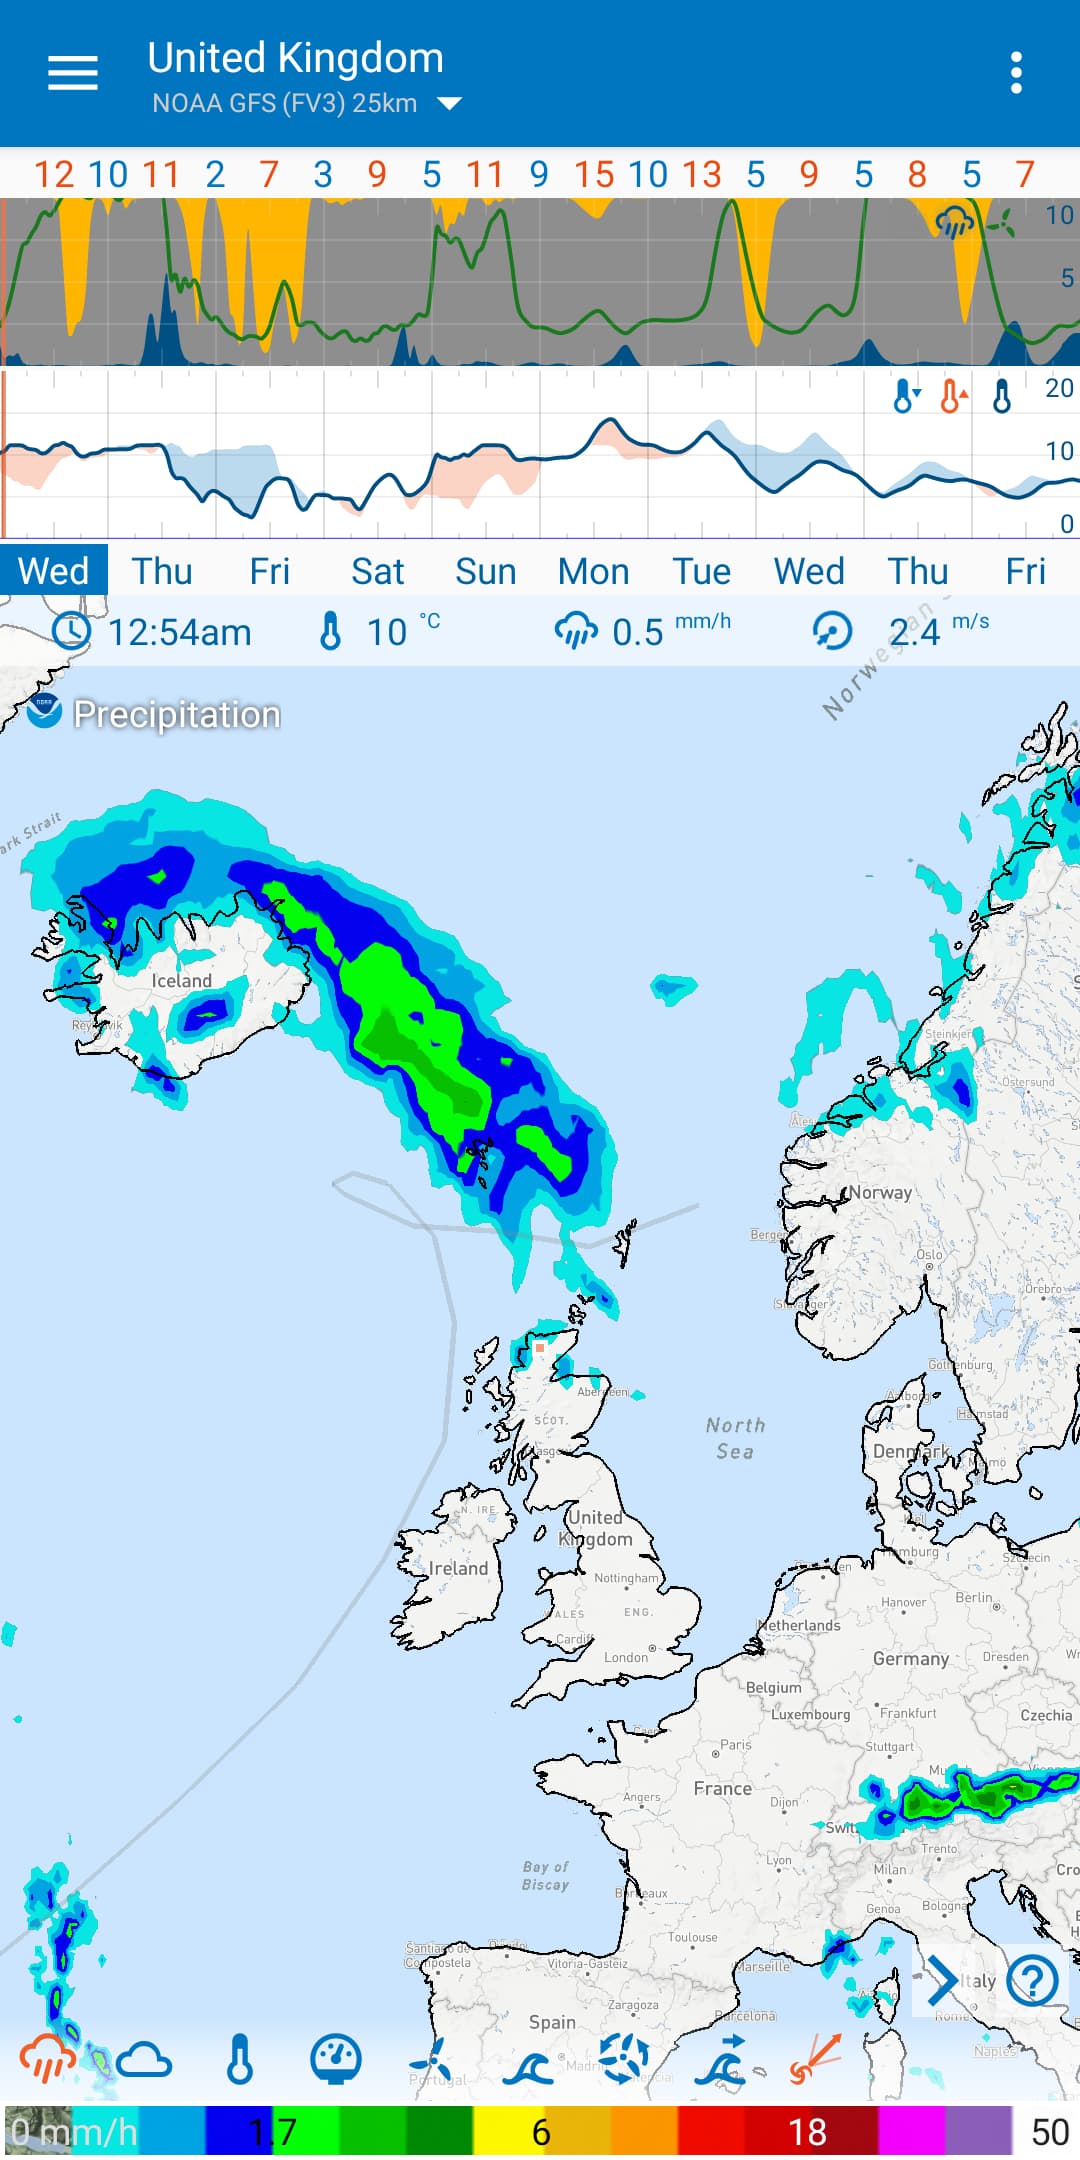
The problem for me is your snapshots show about 12 different countries.
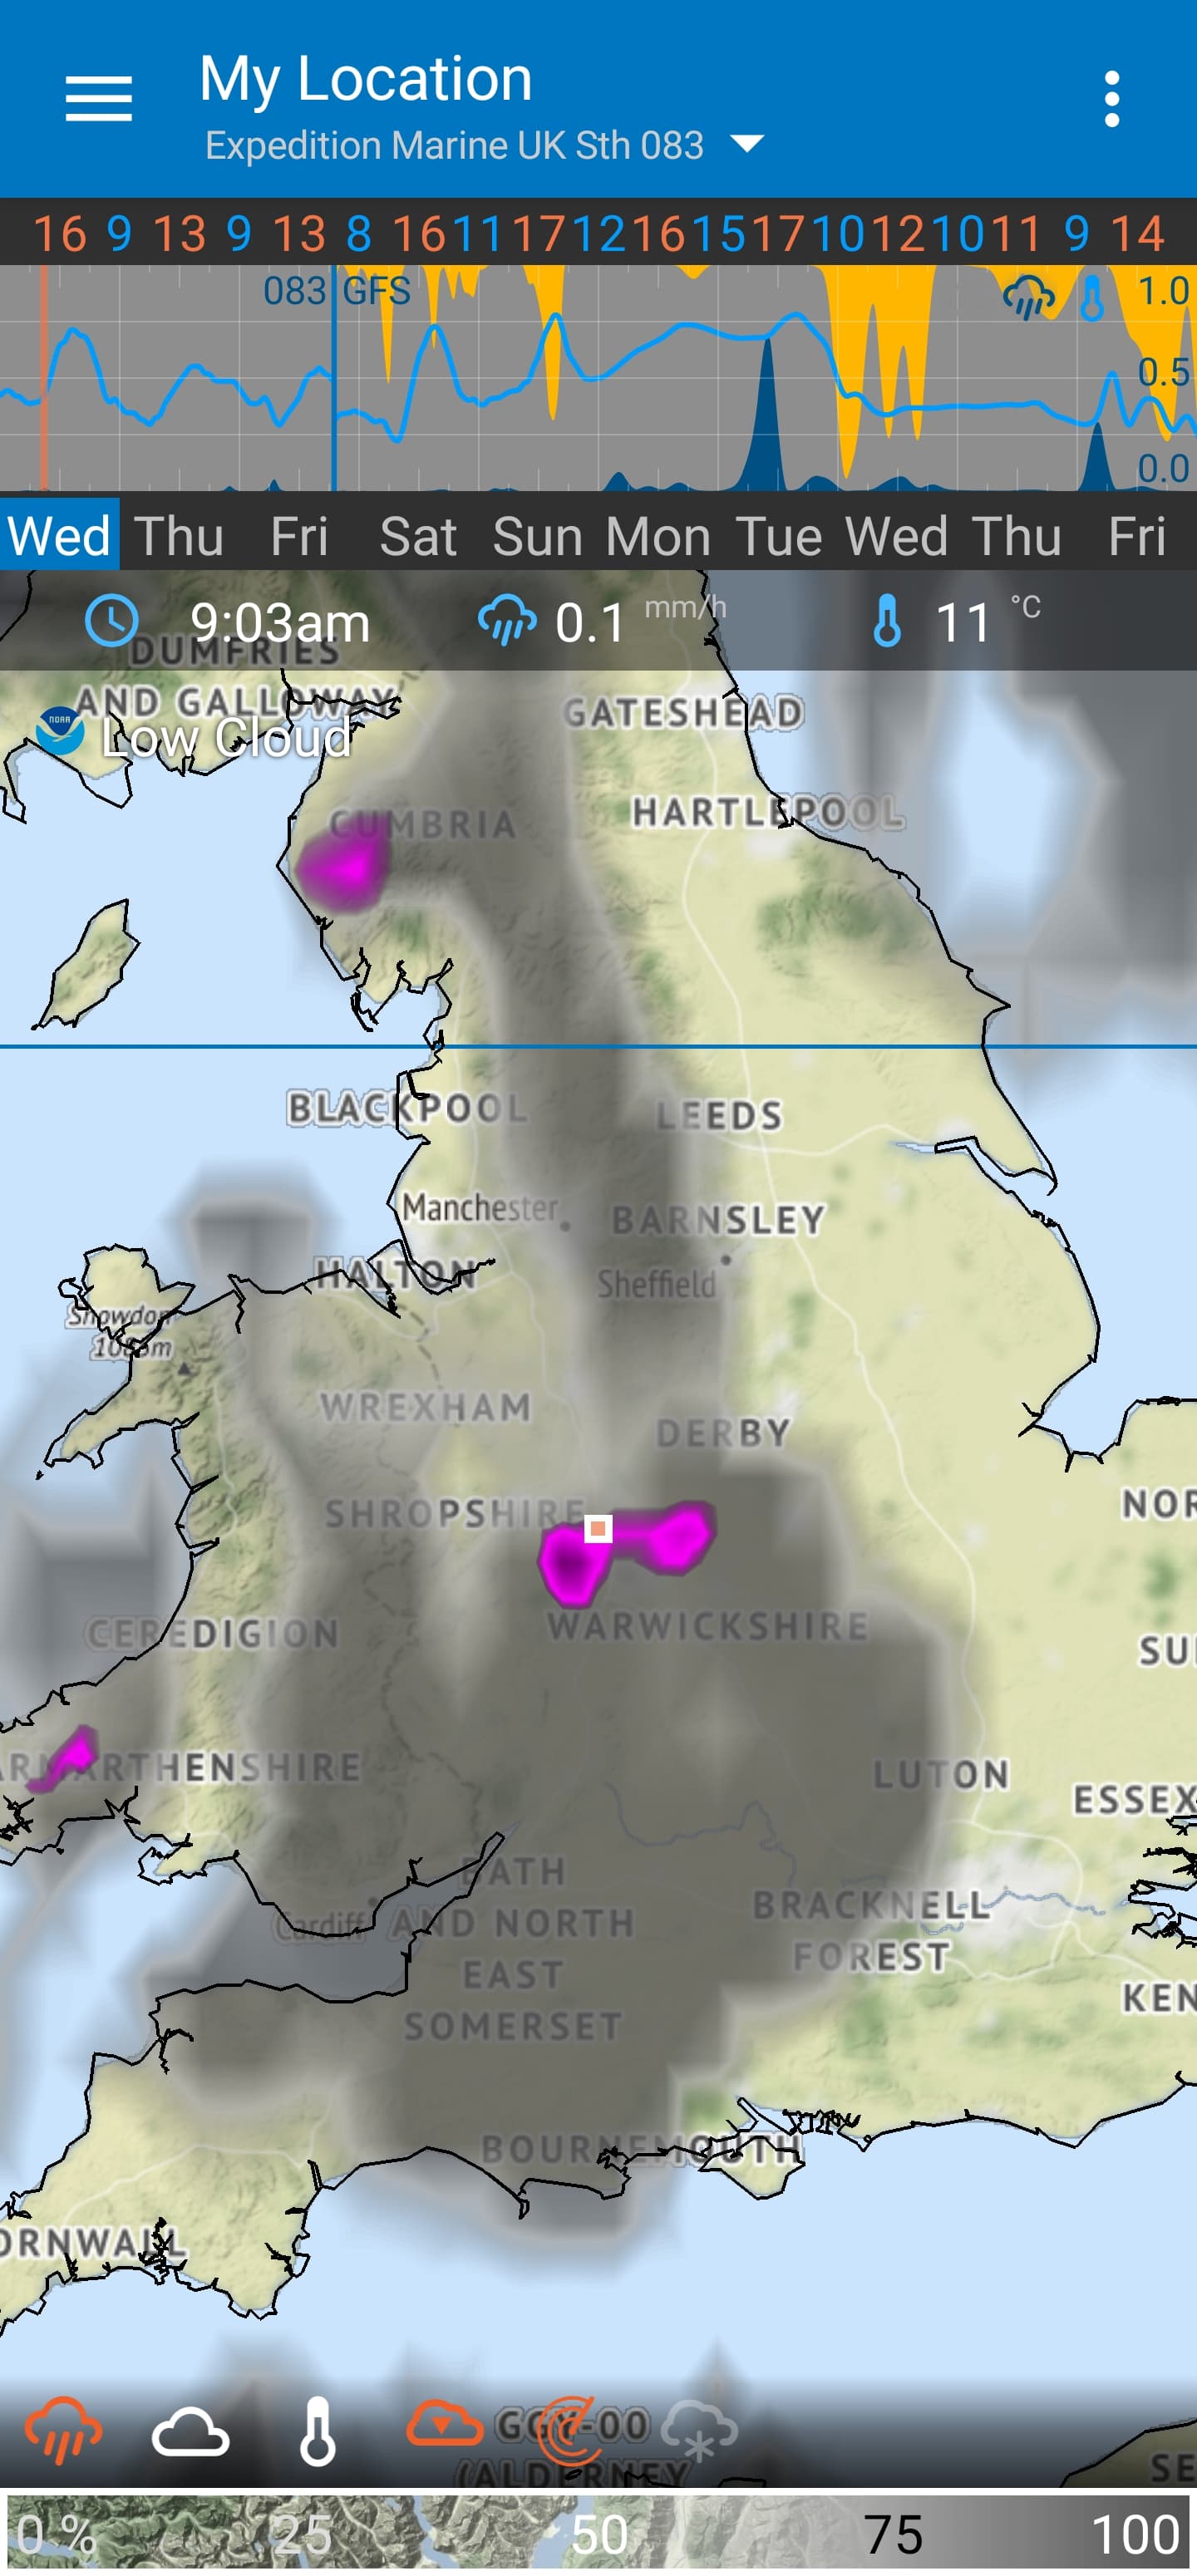
I’m zooming in to England only… and just the middle part. I’m tracking cloud, possible rain.
This morning I was soaked but the graphs were unable to predict this time. Apart from a slight blip in Meto France Abergele and expedition marine.
As I say, if the update is exactly the same for all then no bother.
Hi!
I just want to make sure that understand you correctly.
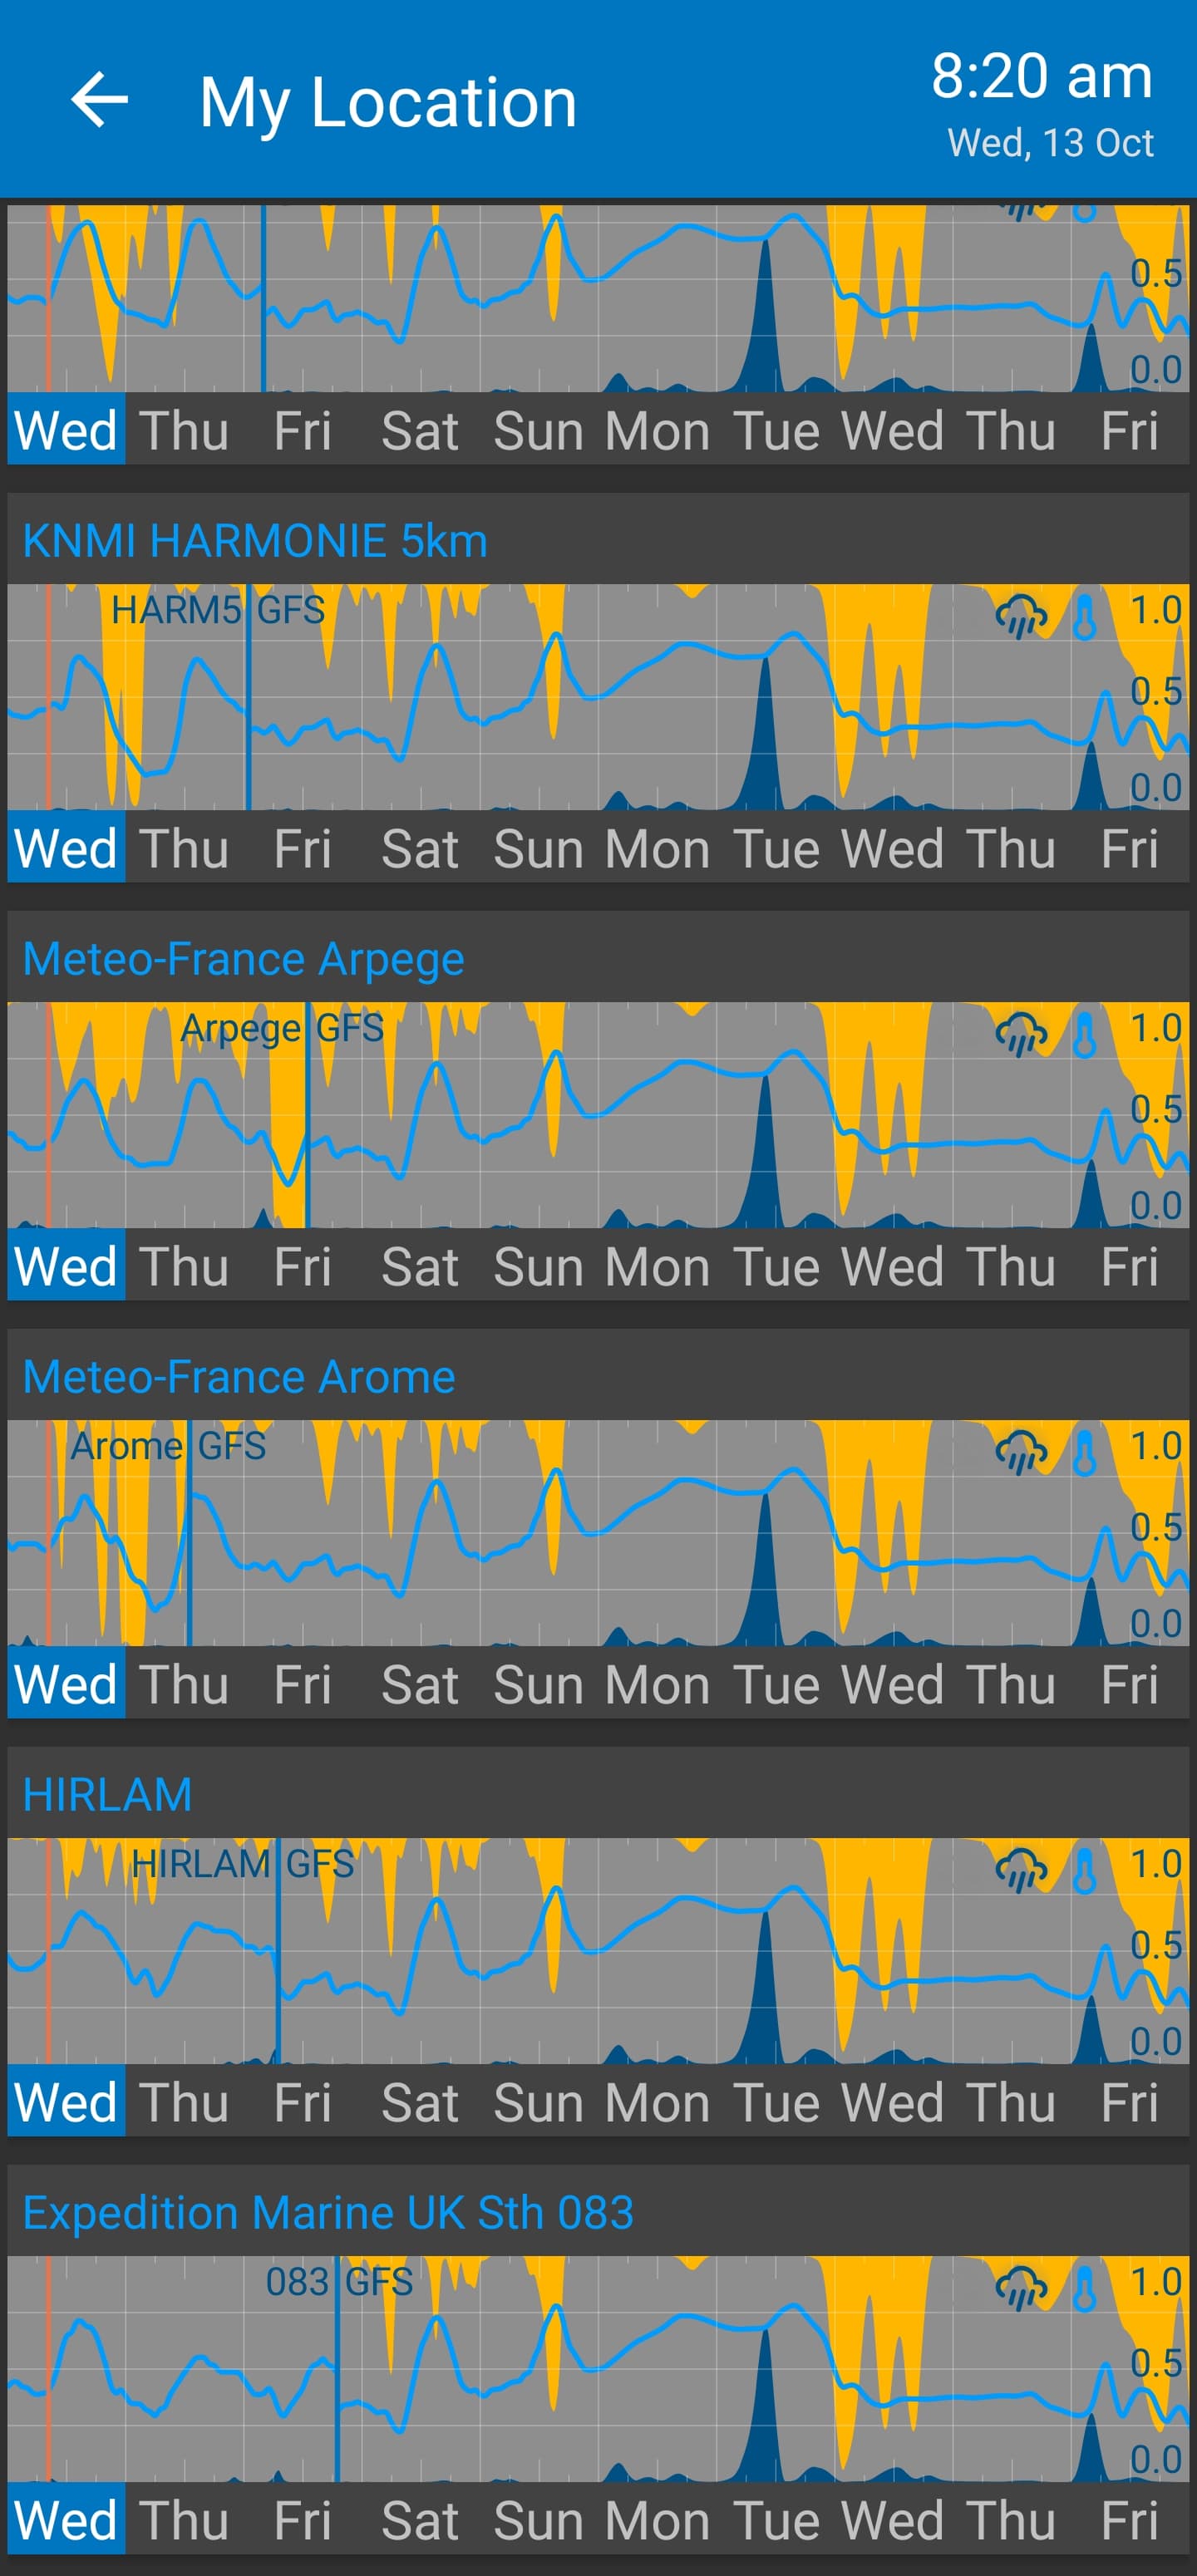
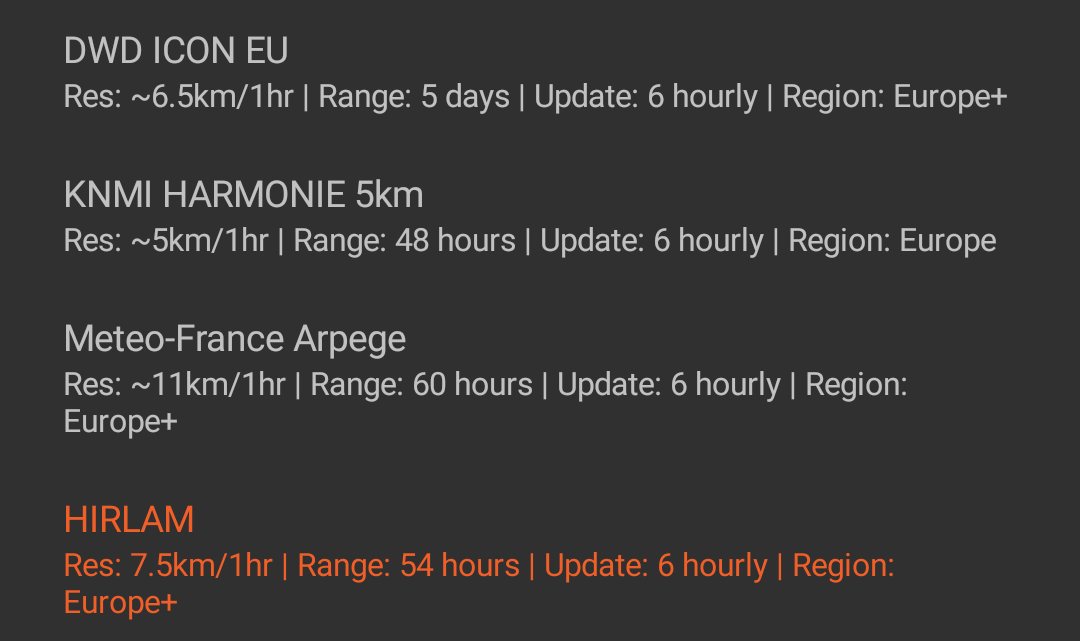
For example, I’m mostly looking at, DWD ICON EU (it’s good overal in my area), but sometimes I’m comparing with Metro-France Arpege (it is sometimes predicting rain better, depending on the type of weather, and direction of the wind, but tends to be predicting more rain than then actually comes), and sometimes I’m looking at HIRLAM.
They all update 6 hourly, and have similar grid resolution.
Are you saying that also in this case “the variability between models due to grid resolution, physics being modelled, numerical methods, starting conditions” have a greater importance for the probability to acuretly predict rain or no rain in the near future, than if the data the model is based on is less than 1 hour old or close to 6 hours old?
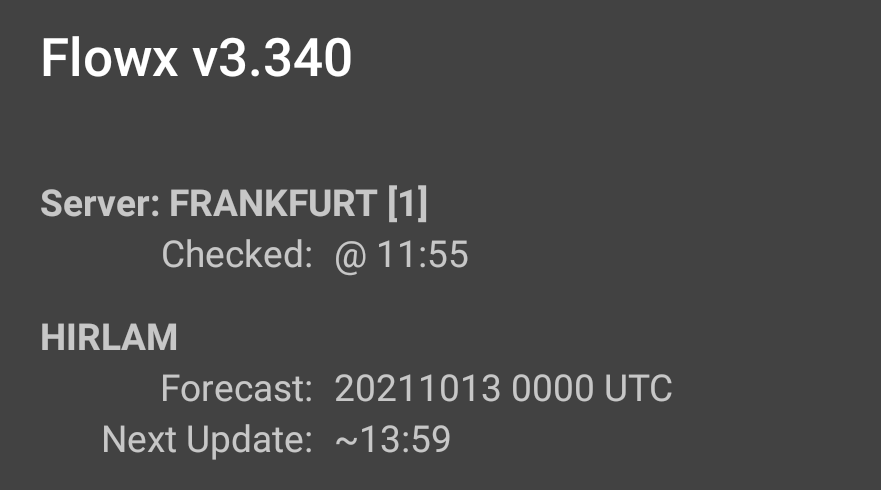
The time associated with a simulation is the time the simulation was started. Different simulations take different times to solve - generally 3-5 hours. Then my workers process the data which takes a few minutes. But the times all the different models are started are 0000UTC, 0600UTC, 1200UTC and 1800UTC so they generally come out at the same time +/- 1-2 hours.
If you check the times for the next update, it’ll tell you how close they are together. I just checked and most of them were within an hour.
Sorry I am finding this hard to explain. I’m not saying the age of a forecast is not important. I am saying, don’t look at the update time alone and choose only the newest model to look at. You get model value out of looking at all models - even if they are older.
For example, there are ensemble weather simulations where they solve the same simulations 20-40 times but with slightly different starting conditions. This is to account for the measurement and extrapolation errors in the input data. This gives 20-40 different weather forecasts!!! Imagine this in Flowx This is done because it’s super valuable for giving the range of possible outcomes.
In other words, the variability in starting conditions is so important they run 20-40 simulations.
This is only an assumption by myself. If releasing a new forecast every 3 hours instead of 6 hours was valuable, then they would’ve. For low resolution models, faster releases than 6 hours don’t add much value. When you get to higher resolution models - 3 hours might be the sweet spot. Even higher, like HRRR, then 1 hour might be optimal.
Yes this is interesting.
It means that in my example I’m not comparing models based on starting conditions that are 1 h ago and 6h ago, but rater the “just updated model” is based on already 3-5 hours old starting conditions, and the “not yet updated model” is based on starting conditions that is 6h + 3-5 hours old.
So the difference, in age for the starting conditions is not 1h vs 6, (a factor of 1 to 6), but rater a difference between 3-5 hours and 9-11 h, (a factor of 1 to 2-3).
So less of a difference than what it seamd (when not factoring in the 3-5 hours it takes to solve the simulations) .
Yes, I do think that I understand you better now, and why:
In order for the
to make proper sence, the information regarding the 3-5 hours it takes to solve the simulations, should be communicated as well.
I can see why you have been hesitant to include this in the graphs due to the risc or misunderstandings regarding its meaning and importance (or lac of importance).
I didn’t want to mention earlier to reduce confusion, but a few models use continuous assimilation so the released result uses mode recent data. I forget which models use continuous assimilation.
Assimilation of measured data is a important part of weather simulations. This is the process of predicting the state of the atmosphere (e.g., pressure) where there is no measurements. This use a combination of measured data surrounding the point of interest and models.
We are all waiting for the long promised theme editor… Hmmm, they are actually a graph element so they should be turned off in the graph editor… I’ll add it to the list.