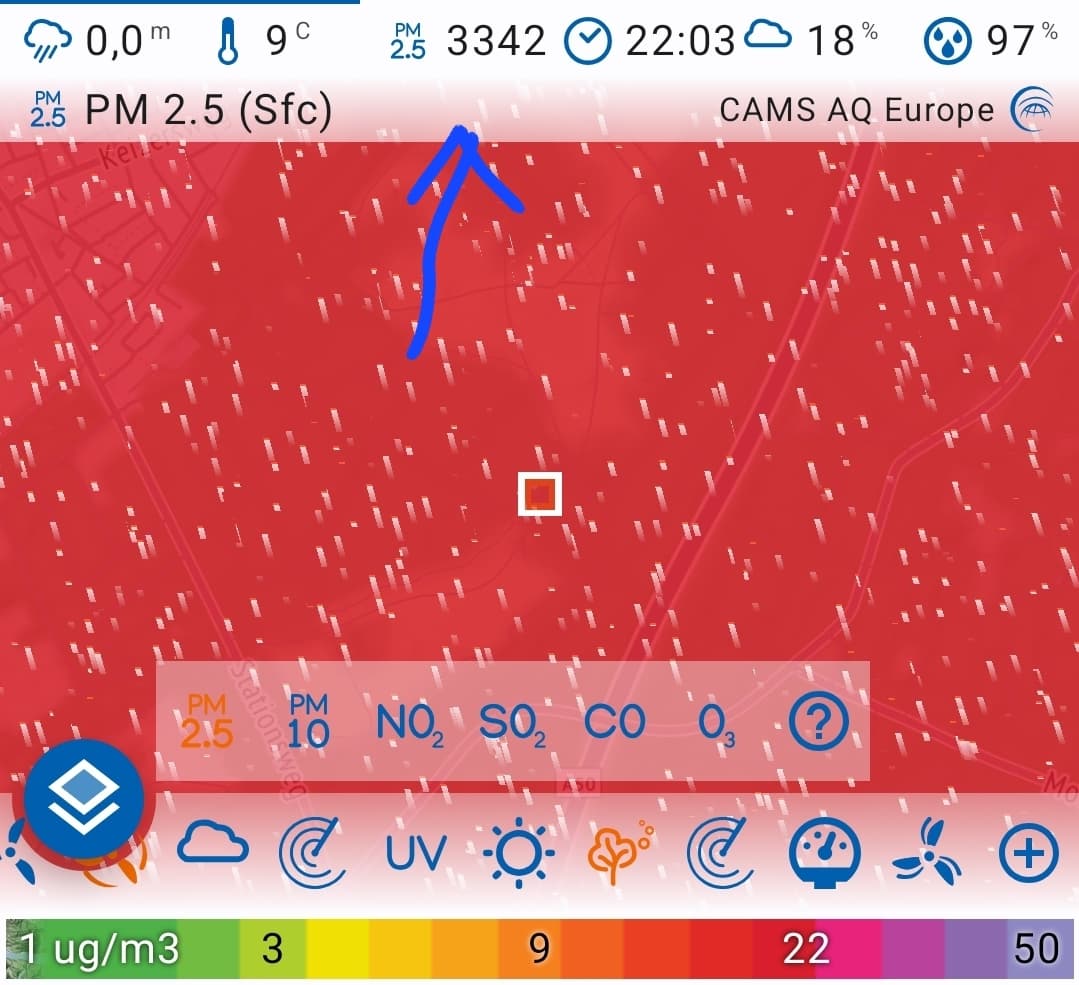
What unit is being used for the air quality display, PM2.5 for example? I’m seeing values over 1000, but I’m used to seeing values in µg/m³, which would make it much easier to set the range in graphs. Also, would it be possible to add the AQI score as well? That would be really handy to include in graphs for a quick overview and I would definitely use it multiple times a day.
Edit: the values on the map and colour scale are in µg/m³, but the number that displays above the map and in the graph do not match. For example:
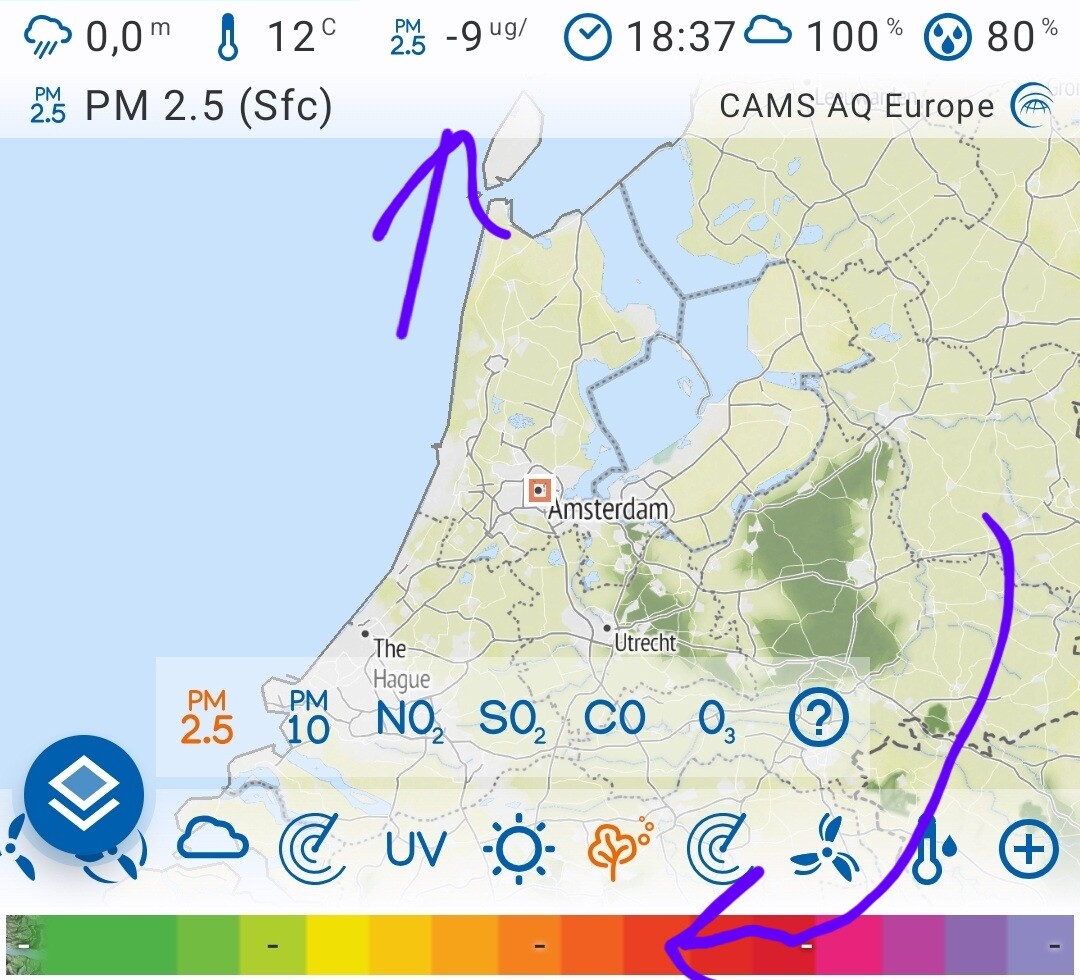
It seems that there is another error in the display of the air quality. A minus count is displayed and no visual overlay is visible as a result. This has been the case for a few days now.
Apart from this, I am very happy that this app exists. I hardly use the other weather apps anymore. Even Windy premium is less user-friendly for the way I use it. Thank you for your hard work