Really love the new Compare feature. Just two suggestions on that:
Can the graphs be movable so I can have my top two or three favorites at the top.
Are there plans to compare across locations so compare London with New York say?
Thanks
Phil
Really love the new Compare feature. Just two suggestions on that:
Can the graphs be movable so I can have my top two or three favorites at the top.
Are there plans to compare across locations so compare London with New York say?
Thanks
Phil
Good idea. Additionally, then the list in the drop-down menu can reflect this. I’ll add this to the todo list.
No plans for comparing locations. That’ll be hard to implement in UI and not be confusing.
Compare mode is brilliant, thanks!! Instantly very useful.
I’m also verry happy about the compare feature!
Some thoughts (besides that I would also be happy about being able to rearrange them):
I miss the vertical line than one can move to the left and to the right, it would make it cognitively easier and faster to compare many graphs at a specific time.
And if the vertical line is added, how about the row that shows the time for the line, (and temperature, rain/snow and wind speed,) could it be added under every graph so that one can see all the numbers for comparison?
And while at it, regarding "the row that shows the time, the temperature and so on, is it possible to configure what is shown on it?
Best regards!
I did wonder about the time line but didn’t see a reason. However your reason is good. I’ve found myself swiping too.
Not sure about the other things. I’m reluctant to rush into something more complex. It’s harder to remove something than add something - users complain. So let’s take it slowly.
Changing the numbers to be shown is on the to-do list.
Cheers, Duane.
Hi!
How about double taping on a graph in the compare view, as a shortcut to going to the map view with the data source selected of the graph that one double taped on?
Cheers!
Hi @Ohan, this is what I was thinking too. I find myself clicking on the graphs to try to go to them. I was thinking of adding swipe and a single click to go to the data source and time where you click. Alternatively we could click on the data source title??
I would argue for dubbeltaping in compare mode for going to data source. The reason being so that one will not leave compare more by accident with only just a single tap.
And I suggest long press for rearranging the order of the data sets. (Maybe both in the compare mode, and in the drop down menu.)
I think that a single tap on a graph, both in compare mode, and in regular mode, should be reserved for jumping to that time, meaning moving the movable horizontal line there, and have that time be displayed on the map as well.
And while at it, I find myself trying to zoom and pan in the graphs, using two fingers, just like one does on a map. So some more suggestions I have for the compare mode are as follows. (Perhaps, if not too confusing, or too much, this could be implemented in regular mode too?)
Two finger pinch vertically on a graph to decrease the hight of all graphs, so that a higher number of graphs will be show in the display (or just more of the map) at the same time.
And the reversed action, two finger vertically un-pinch to indecrease the hight of all graphs, displaying fewer of them (or making the map smalle).
Two finger horisontalt pinch on a graph to increase the time shown in all graphs, zooming out in time,
and two finger horisontalt un-pinch to decrease the time shown in all graphs, zooming in on the timescale.
two finger swipe to the left on a graph to move the time window displayed in the graphs further into the future,
and two finger swipe to the right to move the time window displayed in the graphs further into the past.
@Ohan as for displaying more graphs wouldn’t it be easier to edit graph and add more info? Rather than adding additional graphs? also wouldn’t shrinking graph height make it more difficult to read info? and with smaller graph sizes wouldn’t make it difficult to swipe and tap? Just my thoughts
Vote +1
I would value a non-settings menu way to adjust how many days are presented. A dynamic adjustment.
Same for graphs shown. A dynamic means to update the main screen from 1 graph and the map, to a whole screen of just graphs =cool. I kinda use the widget and app to fulfill these two exact needs.
I got one on double-tap, too! I would like to see double-tap a graph to launch the compare graphs. The long-press and select is logical for the UI, but too slow for access to this valuable data. People love it; integrate it as fast access data @duane in some effective way.
@BrianLY-38 I’m not sure if we are talking about the same thing.
With
I’m referring to that in the compare mode (when being a gold subscriber) the number of data sources are so many that they don’t all fit on the screen at the same time, so I’ll need to scroll.
So if i would like to see them all at the same time, then yes I would sacrifice some hight on the graphs, even it this makes is slightly more difficult to see. And reversly, I would like to be able to “zoom in” meaning increasing the hight and resolution in hight for some of the graphs, even if that then mean that fewer graphs can be displayed, and hence increase the need for scrolling.
All this was a comment for the compare-mode.
But as and as additional thought, this could be used in a similar way to make the fixed number of graphs shown above the map (in normal mode) larger and smaller, without adding or removing any graphs from the display, merely just changing how big fraction of the screen is used for the graphs and how much is used for the map.
@Ohan I see what you’re talking about having to scroll to see the other graphs. I Apologize for misunderstanding your post. Depending on screen size shrinking graph height would really make it difficult too see, tap, etc. However I do see your point about wanting to see all together rather than scrolling. I don’t mind having to scroll but I see your point.
I think I’d prefer to scroll; having everything displayed but too small for my eyes to resolve into information doesn’t help me.
Might be an idea to be able to set a “these are my compare graphs” list. I nigh-certainly don’t want ALL the NOAA information streams, for example. I probably want what I think is the best one, or maybe the best two.
In my case I can display 5 out of 7 data sets, so the zoom out to see all 7 would not be that much.
(Being able to zoom vertically would mean that it’s also possible to zoom in, makeing it even easier to see the graphs.)
I
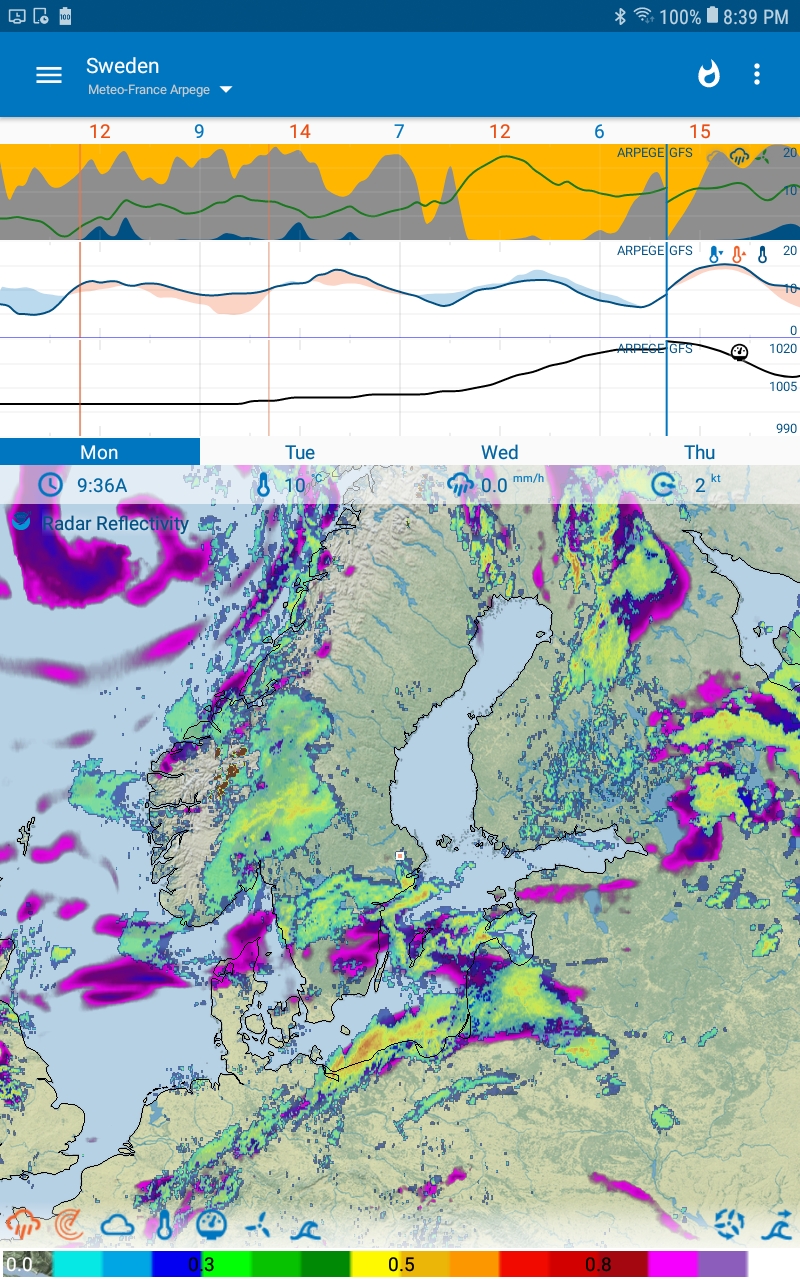
I see now that the gray areas, where the name of the data source and the weekdays are displayed are using a big portion of the screen.
Simply changing the displaying of the weekdays to only once would give back allot of space on the screen for more wether information.
The name of the data source could be overlayed on the graph instead of using a separate area.
Therese two changes would eliminate the need for vertical zoom/scroll for me (until perhaps more data sets are added).
Yes, +1 on that!
Where I live, there are ten data sets; half size vertically would get squinty.
I’d like to be able to be selective about the data sources to compare (I trust some of them much more than others!) more than I’d like to be able to scale them.
I agree about the double-tap-to-compare suggestion.
Wow, you guys seem to sorting it out. I’ll just add my few cents.
Good point. Double-tap to go compare and return the the map is a good idea. I seem to be using the compare function a lot and am getting sick of the long-press-compare process.
Double-tap vote +1 - and my vote is final ![]()
Regarding the vertical zooming: I agree with this in principal but it’s damn difficult to do in practice. The graphs are plotted to be pixel perfect so the graphs would have to be redrawn as you zoom which is not cheap.
Alternatively we could zoom an outlines or scale the current image without redrawing the graphs until you release the zoom which is when the graph would be redrawn to be pixel perfect. This would be the appropriate approach but I don’t know how hard this is to implement.
The other option is to have a setting to adjust it - super easy but adds clutter to the settings.
Regarding the horizontal zoom: again I agree, and it’s on the todo list, but it suffers from the same difficulties plus having to download extra data on the fly.
Regarding the horizontal double-finger swipe: also considered this and it’s difficult.
When I consider all these ideas, I agree with them, but I take time to think about them, especially if they are complex and difficult to implement. I implement the idea and it takes a lot of time, becomes difficult to maintain, adds bugs, increases support emails and then only <1% of people use it daily, then it’s a damn expensive feature.
Remember this time can be used to add features that more people would use, like Radar ![]()
Which would you vote for: graph zoom or radar - be honest.
If you contrast the zoom to the double-tap which would take an hour to add, is very simple code, is unlikely to add bugs, it’s a no-brainer. My hesitation was that gestures are a rare thing and I think long before using one and whether it’s worth using for the compare function.
So my suggestion is that I implement:
We leave the zooming on the todo list. Maybe in the future have a beta setting in order to see how much it’s used, etc…
Cheers, Duane.
Totally agree. This was the simple way to display the data quickly. Maybe we can put the source label in where the icons are. BTW, who still uses or refers to the icons?
Maybe we can remove the card display, and have days on every odd numbered graph.
Aside: This may solve the vertical zooming need. This is another reason I thing for a long time about a feature because a simpler solution may present itself.